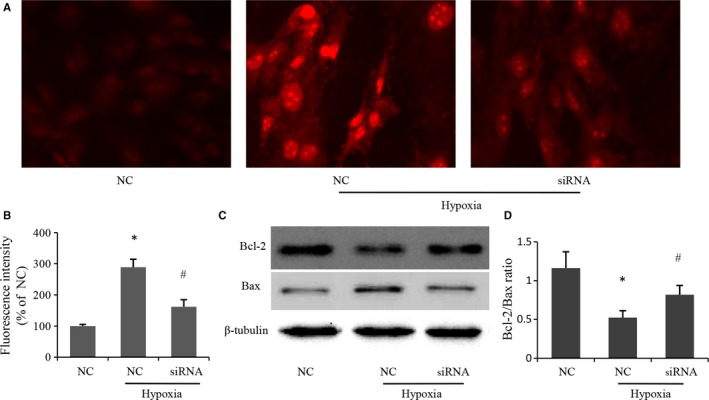
Figure 5.

Effects of MR depletion on ROS production and expression of apoptotic proteins induced by hypoxia. (A) Representative photomicrographs of intracellular ROS in MSCs visualized by fluorescent microscopy. Red fluorescent intensity indicated ROS accumulation. (B) Quantitative analysis of red fluorescent intensity in individual group. Data were collected from three independent experiments. (C) Apoptotic proteins determined by immunoblotting in MSCs subjected to hypoxia or normoxia. (D) Quantitative analysis of Bcl‐2/Bax ratio using data from three independent experiments. *P < 0.05 vs NC, # P < 0.05 vs NC+hypoxia
