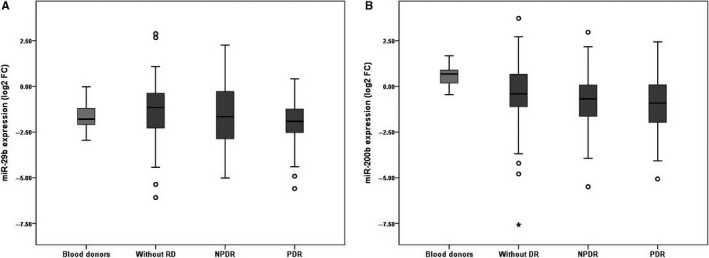
Figure 1.

Comparative analysis of plasma levels of miR‐29b (A) and miR‐200b (B) in blood donors and type 2 diabetic patients according to the presence and severity of diabetic retinopathy. Expression levels are expressed as log2 fold change. A, P < 0.05 for the comparison of patients with proliferative DR and those without DR after correction for multiple testing (Tukey test). B, P < 0.05 for the comparison of diabetic patients without DR and blood donors (Mann‐Whitney test)
