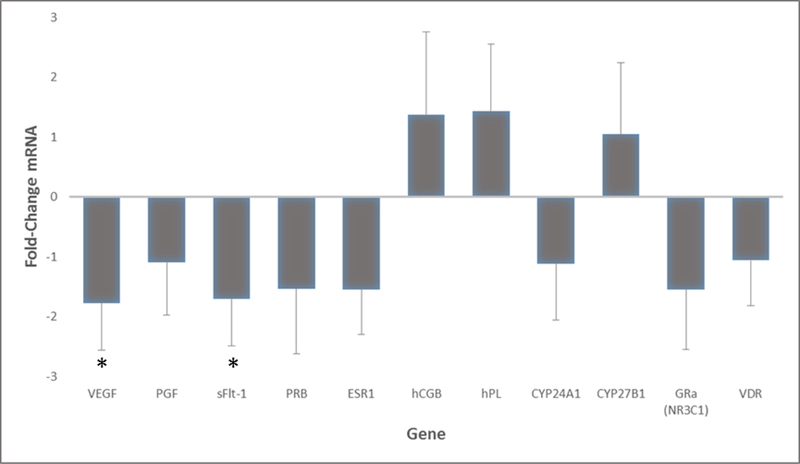
Figure 2.
Placental target gene expression in vitamin D sufficient cohort as compared to deficient women. Calculated fold change difference between vitamin D deficient vs sufficient groups. Shown negative values indicate downregulation and positive values indicate upregulation in women who were sufficient. Comparatively, vitamin D sufficiency resulted in downregulation of all but three of the genes tested. Results represent the fold change +/− standard deviation of each target gene. Genes with significant results are shown with an asterisk (*).

