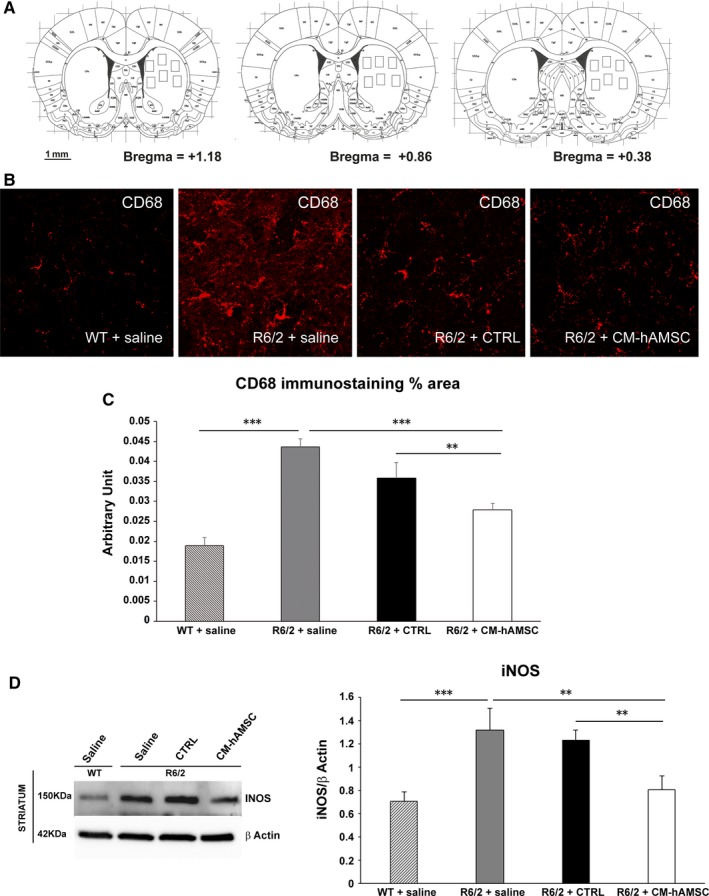
Figure 5.

Conditioned medium from hAMSC (CM‐hAMSC) treatment attenuates neuroinflammation in R6/2 mice. A, Squares represent areas of tissue sampling for quantification of CD68 immunostaining. B, Confocal laser scanning microscopy (CLSM) images of single‐label immunofluorescence for CD68 (visualized in red‐Cy3 fluorescence) in the striatum region from wild‐type mice, R6/2 mice treated with saline, CTRL and CM‐hAMSC. C, Histogram showing the microglial reactivity quantification by NIH software. Data are presented as the mean values of CD68 positive areas ±SEM, (**P < 0.001; ***P < 0.001). D, M1 macrophage marker inducible nitric oxide synthase (iNOS) protein levels were evaluated by Western Blot in striatal homogenates from wild‐type mice (WT) and saline‐, control medium (CTRL)‐ and CM‐hAMSC‐treated R6/2 mice. Protein levels were normalized against the expression of beta‐actin. Protein blot signal intensity analysis performed by Imagej software is represented in the graphs (**P < 0.01; ***P < 0.001)
