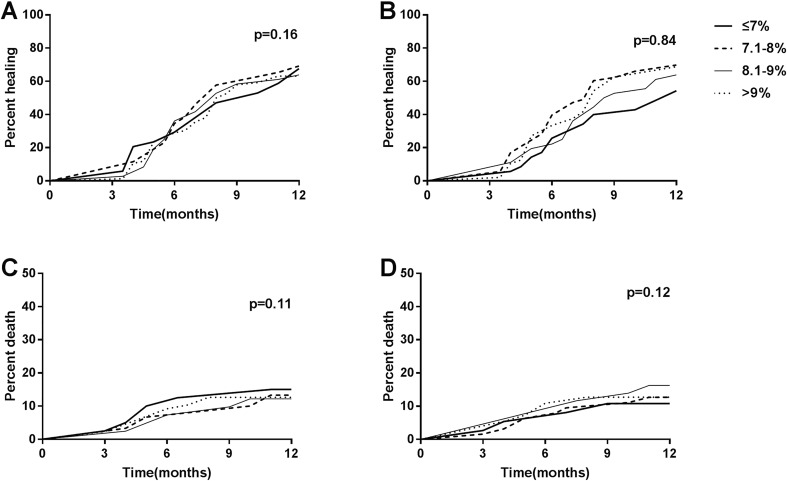
Fig. 1.
Kaplan–Meier curves of ulcer healing among different a baseline HbA1c groups or b groups stratified by mean HbA1c during treatment. Kaplan–Meier curves of death among different c baseline HbA1c groups or d groups stratified by mean HbA1c during treatment. HbA1c measurements were categorized as quartiles (≤ 7.0%, 7.1–8.0%, 8.1–9.0%, > 9.0%). Thick solid line, HbA1c ≤ 7.0%. Dashed line, HbA1c 7.1–8.0%. Thin solid line, HbA1c 8.1–9.0%. Dotted line, HbA1c > 9.0%. Log-rank test was used to make comparisons of ulcer healing and death among different groups stratified by baseline HbA1c or mean HbA1c during treatment

