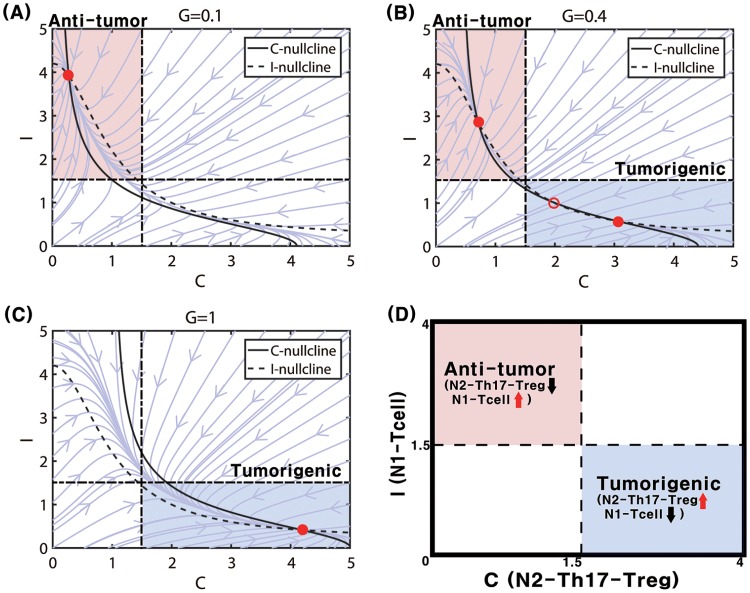
Fig 5. Nonlinear dynamics.
Dynamics of the system (5) and (6) in the C-I phase plane in response to low (G = 0.1 in (A)), intermediate (G = 0.4 in (B)), and high (G = 1.0 in (C)) levels of TGF-β-induced transition signals. Steady states marked with circles (stable steady state = filled circle, unstable steady state = empty circle). (D) A schematic of anti-tumorigenic (C < Cth, I > Ith) and tumorigenic (C > Cth, I < Ith) regions in the C − I plane. S = 0.2 fixed. Other parameters are given in Table 2.

