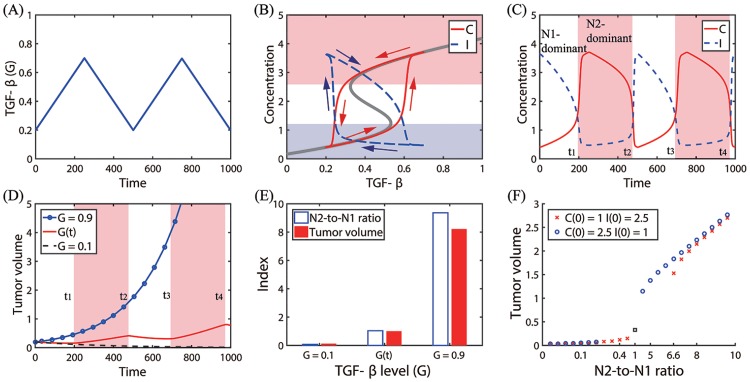
Fig 8. Effect of fluctuating TGF-β on tumor growth.
(A) A time-dependent TGF-β level was assigned for a periodic supply of TGF-β in tumor microenvironment. (B) Trajectories of solutions ((G(t), C(t)) and (G(t), I(t))) in response to TGF-β in (A). The thick gray curve represents the upper and lower branches of steady states (C − G hysteresis bifurcation loop in Fig 6). Red and blue arrows = solution flow direction of C and I, respectively. (C) Time courses of concentrations of C and I in response to periodic G input in (A). The N2-dominant -regions were shaded in pink. (D) Time courses of tumor volumes in response to a fixed (G = 0.9 (blue circle); G = 0.1 (dashed)) and fluctuating TGF-β level. Fluctuating TGF-β levels induce transitions between N1- and N2-dominant phenotypes, leading to transient tumor growth at the transition times (t1, t2, t3, t4). (E) The N2-to-N1 ratio and tumor size for three TGF-β conditions in (D). (F) Positive correlations between the tumor volume and the N2-to-N1 ratio with two initial conditions (C(0) = 1, I(0) = 2.5 in red asterisk; C(0) = 2.5, I(0) = 1 in blue circle). Initial conditions in (A-E): C(0) = 0.4, I(0) = 3.6, G(0) = 0.2, T(0) = 0.2. Other parameters are given in Table 2.

