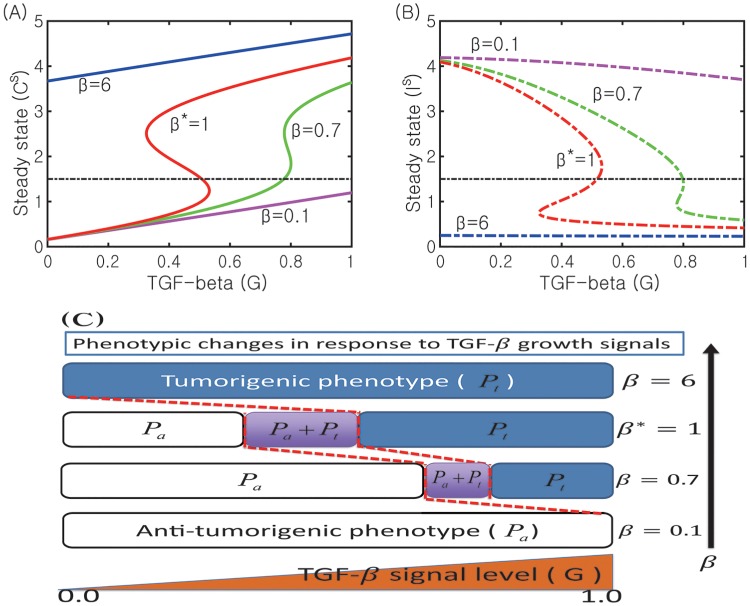
Fig 10. Effect of the inhibition parameter (β) on the transitions between N1 and N2 system.
(A, B) Bifurcation curves G − C (Cs in (A)) and G − I (Is in (B)) for for various N1 inhibition strengths (β = 0.1, 0.7, 1.0*, 6.0). (C) The corresponding phenotypic switches between tumorigenic and anti-tumorigenic phases when β is varied. Other parameters are fixed as in Table 2. The base case (β* = 1.0) was marked in star (*).

