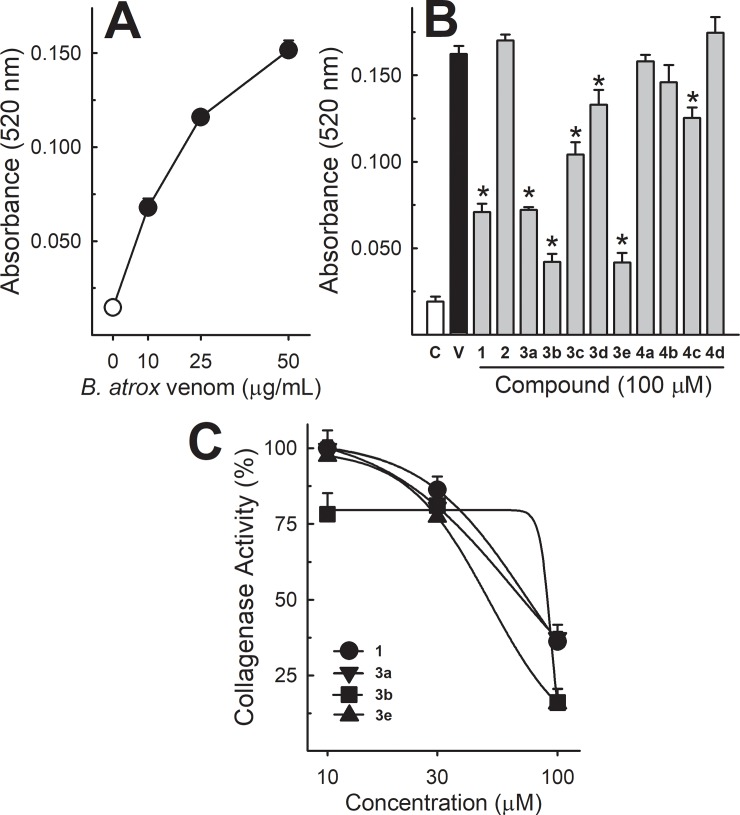
Fig 3. Collagenase activity of B. atrox venom, and the effect of lapachol and analogues.
Panel A shows the collagenase activity curve of B. atrox venom (10–50 μg/mL) (n = 5). Panel B shows the inhibition of B. atrox venom (50 μg/mL) by lapachol (1) and analogues (numbers 2–4) at 100 μM (n = 5). Panel C shows the inhibition of collagenase activity by compounds 1, 3a, 3b and 3e in a concentration-dependent way (n = 5). One-way ANOVA Dunnett’s post-hoc test * p<0.05 vs B. atrox venom.

