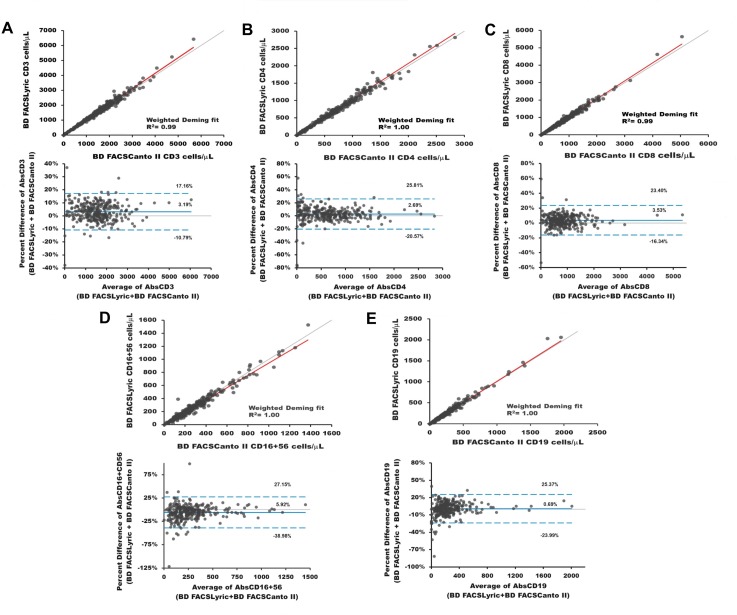
Fig 2. Deming regression and Bland-Altman plots of the absolute counts of T-, B-, and NK lymphocytes identified with the BD Multitest 6-Color TBNK reagent.
This is the Fig 2 legend. The T- cells (CD3+, CD3+CD4+ and CD3+CD8+) shown as A, B, and C; the NK lymphocytes in D, and the B-lymphocytes are depicted in E stained with BD Multitest 6-Color TBNK reagent. The Deming regression are the upper plots with identity line (grey) and the Weighted Deming regression line (red) of each subset. The x-axis depicts BD FACSCanto II cell counts and the y-axis shows the BD FACSLyric counts. The Bland-Altman graphs are the lower plots of each subset, with the bias line (blue solid line) and the upper and lower limits of agreement (blue dotted lines). For these plots, the x-axis corresponds to the average of the lymphocyte marker, and the y-axis represents the estimated percent difference of the absolute counts between systems.

