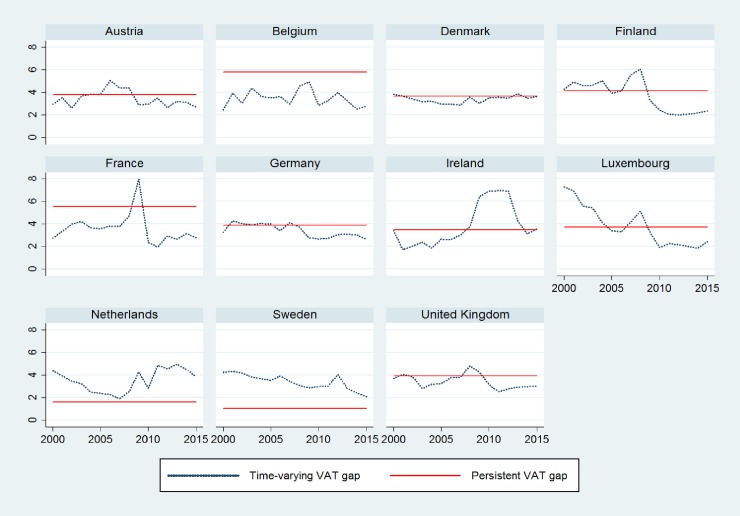
Fig 1. Time-varying VAT gap and persistent VAT gap in the western group of EU countries.
The blue dotted line represents the time-dependent Value Added Tax gap and the red line represents the country-specific or persistent Value Added Tax gap, between 2005–2015. The persistent and time-dependent VAT gap was generated in STATA after the STFM estimation.

