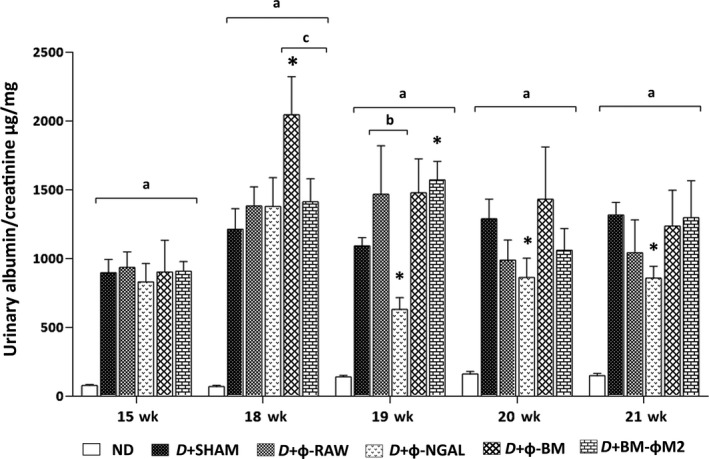
Figure 1.

Albumin evolution analysis. Urinary albumin and creatinine were assessed before (15 wk) and during (18 wk, 19 wk, 20 wk and 21 wk) macrophage cell therapies. Non‐diabetic (ND) mice did not show an increase of the albumin/creatinine ratio. Control diabetic mice (D+SHAM) displayed persistent albumin/creatinine ratio whereas D+Φ‐NGAL treated mice showed a significant reduction from 19 wk. D+Φ‐RAW as a control to D+Φ‐NGAL and D+Φ‐BM as a control to D+BM‐ΦM2 did not show a significant decrease in any time‐point. Any other group exhibited a significant decrease. All diabetic mice (D) showed statistical significance vs ND animals. Data are represented as mean ± SE. *P ≤ 0.05 vs D+SHAM; a P ≤ 0.05 vs ND; b P ≤ 0.05 vs D+Φ‐RAW; c P ≤ 0.05 vs D+Φ‐BM
