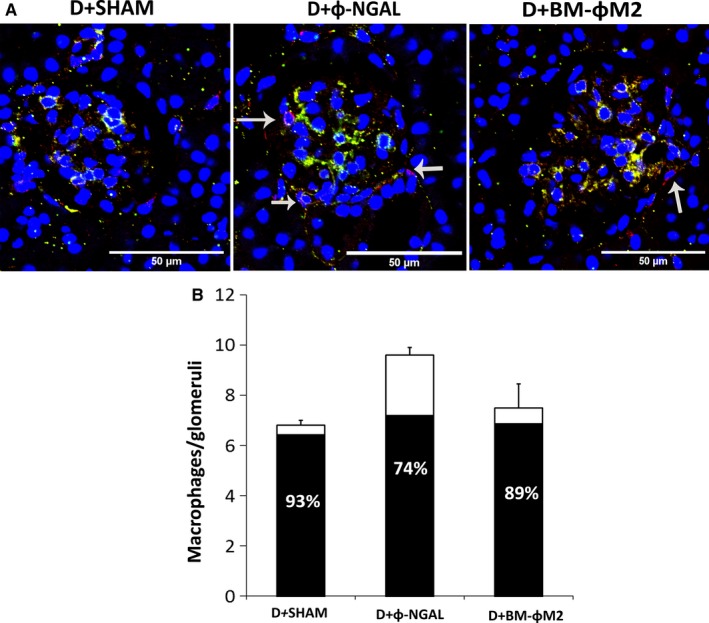
Figure 4.

Evaluation of glomerular macrophages expressing CD86 (M1) marker. Glomerular detail (×400) using F4/80 (red) and CD86 (green) staining in order to identify general macrophages and M1 phenotype subpopulation (A). Double positive macrophages become yellow. The arrows show F4/80 positive macrophages that do not co‐express CD86 marker. (B) Number of macrophages per glomeruli. Each bar represents the mean number of macrophages F4/80 per glomeruli and per group. The black area in the bars indicates the percentage of the total macrophages that show M1 phenotype (n = 9 per group). Data are represented as mean ± SE
