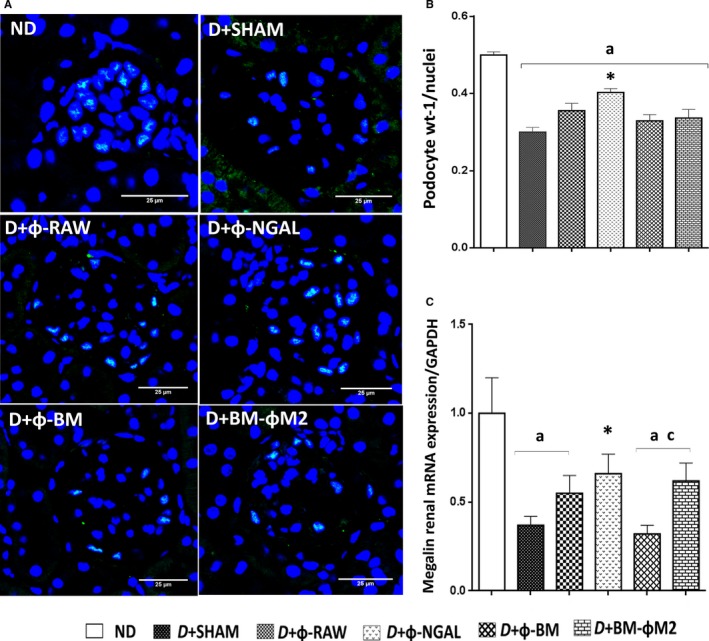
Figure 5.

Evaluation of glomerular podocytes. Podocytes are stained with WT‐1 (green) and nuclei with DRAQ5 (blue) (×400). B, Quantification number of podocytes per nuclei in ten glomeruli; ф‐NGAL therapy increased the presence of glomerular podocytes while its control group ф‐RAW and the others showed similar results. C, Megalin mRNA expression in kidney tissue demonstrated more renal integrity in D+ф‐NGAL mice. Each bar represents the mean ± SE from each group. n = 9 in each group diabetic group and n = 8 in ND group. *P ≤ 0.05 vs D+SHAM; a P ≤ 0.05 vs ND; b P ≤ 0.05 vs D+Φ‐RAW; c P ≤ 0.05 vs D+Φ‐BM
