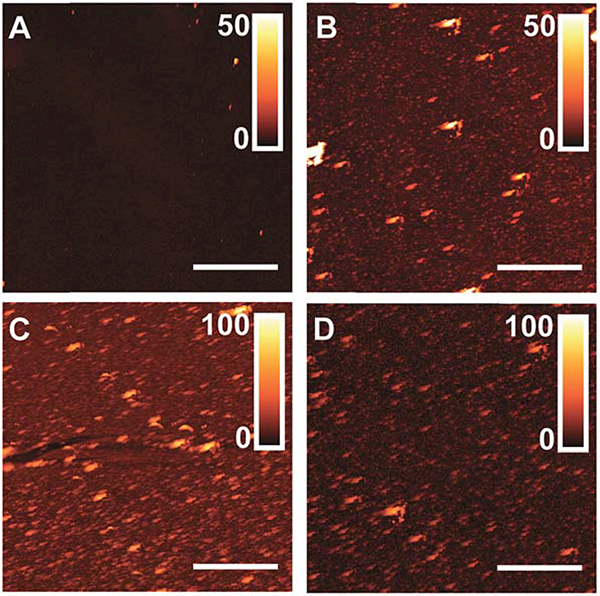
Fig. 2.

Atomic force microscopy images of titania nanofilms with varying (PAH/TALH)n layers, post-calcination and rinsing. Color gradients (inset) represent z-axis height in nm, and scale bars represent 4 μm. (A) (PAH/TALH)1. (B) (PAH/TALH)3. (C) (PAH/TALH)5. (D) (PAH/ TALH)10.
