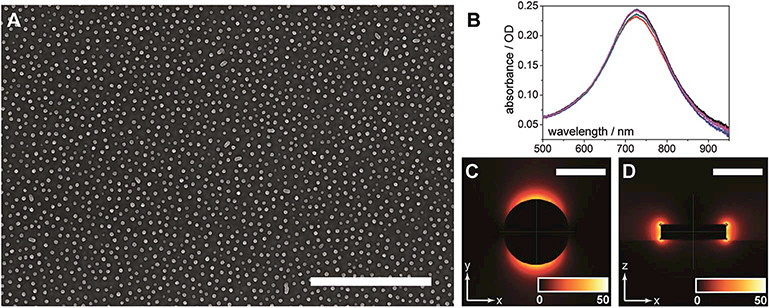
Fig. 3.

Characterization of gold nanodiscs. (A) SEM image of gold nanodiscs fabricated through hole-mask colloidal lithography (HCL), scale bar represents 2 μm. (B) LSPR spectra of AuNDs in air, exhibiting high reproducibility. Peak wavelength occurs at 727 ± 0.45 nm (n = 5 substrates). (C) Finite-difference time-domain (FDTD) simulation of electromagnetic (EM) field distribution (top view), color gradient (inset) represents EM intensity in arbitrary units, and scale bar represents 150 nm. (D) FDTD simulation of EM field distribution (side view), color gradient (inset) represents EM intensity in arbitrary units, and scale bar represents 150 nm.
