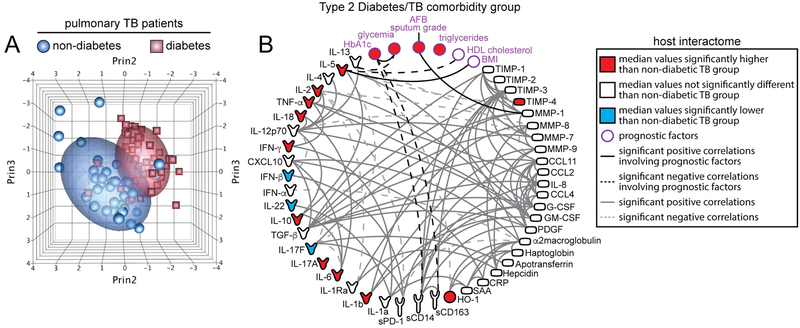
Figure 2. Biosignature of TB-diabetes comorbidity.
Plasma levels of several markers of inflammation, immune activation, growth factors, and tissue remodeling were compared between pulmonary TB patients with or without type-2 diabetes (n=44 patients per group). (A) Principal component analysis of candidate biomarkers for TB-diabetes comorbidity. All the biomarkers used in the principal component analysis models are displayed in (B). (B) Spearman correlation matrix displayed as circus plot, describing associations between the circulating concentration of the candidate biomarkers and previously described prognostic factors. Variables are colored in red or blue if the levels in patients with diabetes and TB were significantly higher or lower (P<.05) than in patients with TB without diabetes, respectively, using Mann-Whitney tests after adjusting for multiple measurements (Holm method). The data presented were generated in collaboration with Dr. Subash Babu (NIAID, NIH) and Pavan Kumar (National Institute for Research in Tuberculosis, Chennai, India) and obtained from samples from patients previously studied: Andrade BB, Kumar NP, Sridhar R, Banurekha VV, Jawahar MS, Nutman TB, et al. Heightened plasma levels of heme oxygenase-1 and tissue inhibitor of metalloproteinase-4 as well as elevated peripheral neutrophil counts are associated with TB-diabetes comorbidity. Chest 2014;145: 1244–54. doi: 10.1378/chest.13–1799.

