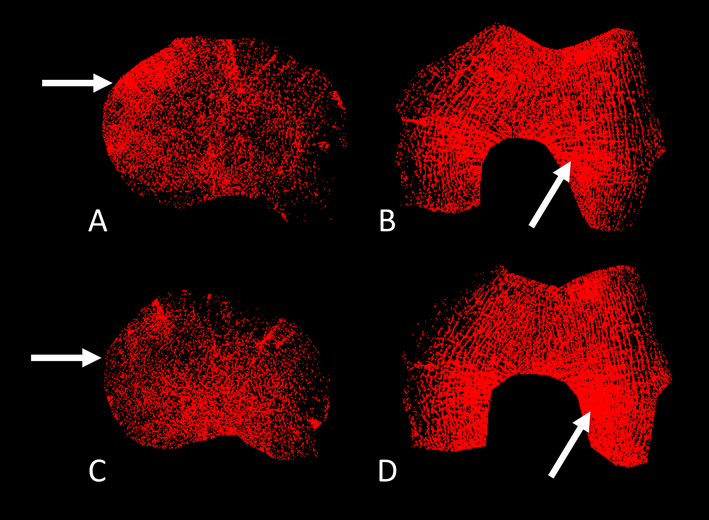
Figure 3.
MR-derived trabecular thickness maps showing change of trabecular thickness in the bone of the medial and lateral tibia (A, C) and the medial and lateral femur condyle (B, D). Maps generated immediately before HTO (A, B) and at 1.5-year follow-up (C, D). Horizontal white arrows indicating decrease in trabecular thickness over 1.5 years in the medial tibia. Oblique white arrows indicating increase of trabecular thickness over 1.5 years within the lateral femur.

