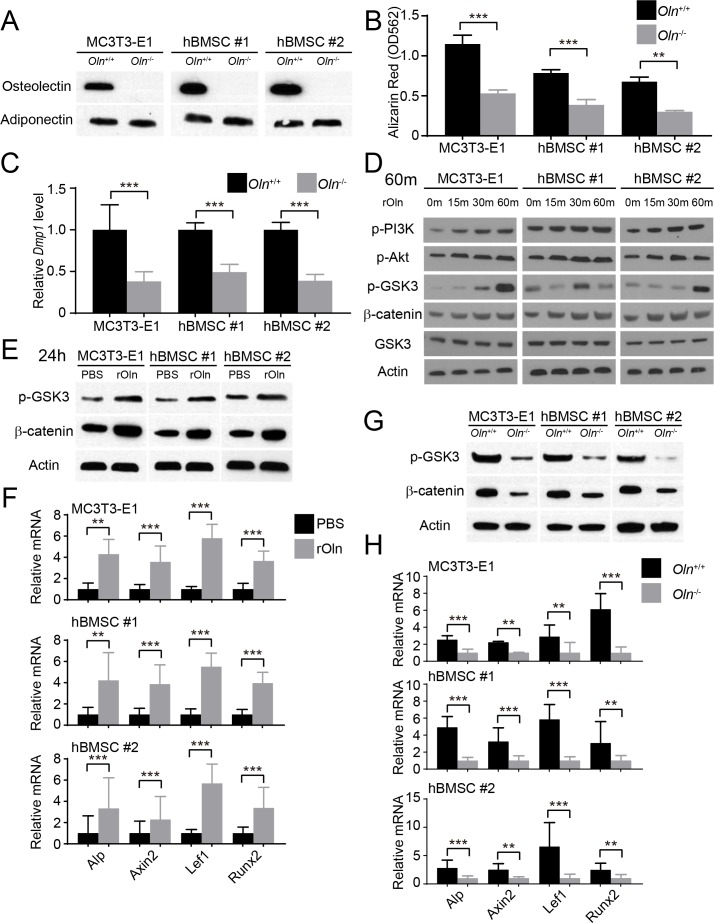
Figure 2. Osteolectin activates Wnt pathway signaling in skeletal stem/progenitor cells.
(A) Western blot of cell culture supernatant from parental or Osteolectin deficient MC3T3-E1 cells and human bone marrow stromal cells (hBMSC#1 and hBMSC#2 cells) (this blot is representative of blots from three independent experiments). (B) Osteogenic differentiation in culture of parental or Osteolectin deficient MC3T3-E1 cells, hBMSC#1 cells, and hBMSC#2 cells. Alizarin red staining was performed after 14 days (for MC3T3-E1 cells) or 21 days (for hBMSC cells) to quantify osteoblast differentiation and mineralization (n = 3 independent experiments). (C) qRT-PCR analysis of Dmp1 transcript levels in MC3T3-E1 cells, hBMSC#1 cells, and hBMSC#2 cells after 14 to 21 days of osteogenic differentiation (n = 5 independent experiments). (D) MC3T3-E1 cells, hBMSC#1 cells, and hBMSC#2 cells were stimulated with recombinant mouse Osteolectin (rOln) in osteogenic differentiation medium then lysed 0, 15, 30, or 60 min later and immunoblotted for phospho-PI3K, phospho-Akt, phospho-GSK3, β-catenin, total GSK3, and Actin (results are representative of 3 independent experiments). (E) MC3T3-E1 cells, hBMSC#1 cells, and hBMSC#2 cells were transferred into osteogenic differentiation medium for 24 hr with PBS or recombinant mouse Osteolectin, lysed, and immunoblotted for phospho-GSK3, β-catenin, and Actin (this blot is representative of blots from three independent experiments). (F) qRT-PCR analysis of Wnt target gene transcript levels (Alkaline phosphatase, Axin2, Lef1, or Runx2) in MC3T3-E1 cells, hBMSC#1 cells, and hBMSC#2 cells 24 hr after transfer into osteogenic differentiation medium, with PBS or recombinant mouse Osteolectin (n = 5 independent experiments). (G) Parental or Osteolectin deficient MC3T3-E1 cells, hBMSC#1 cells, and hBMSC#2 cells after 24 hr in osteogenic differentiation medium were lysed and immunoblotted for phospho-GSK3, β-catenin, and Actin (this blot is representative of blots from three independent experiments). (H) qRT-PCR analysis of Wnt target gene transcript levels in parental or Osteolectin deficient MC3T3-E1 cells, hBMSC#1 cells, and hBMSC#2 cells 24 hr after transfer into osteogenic differentiation medium (n = 5 independent experiments). All numerical data reflect mean ±standard deviation. The statistical significance of differences was determined with two-way ANOVAs with Sidak’s multiple comparisons tests.

