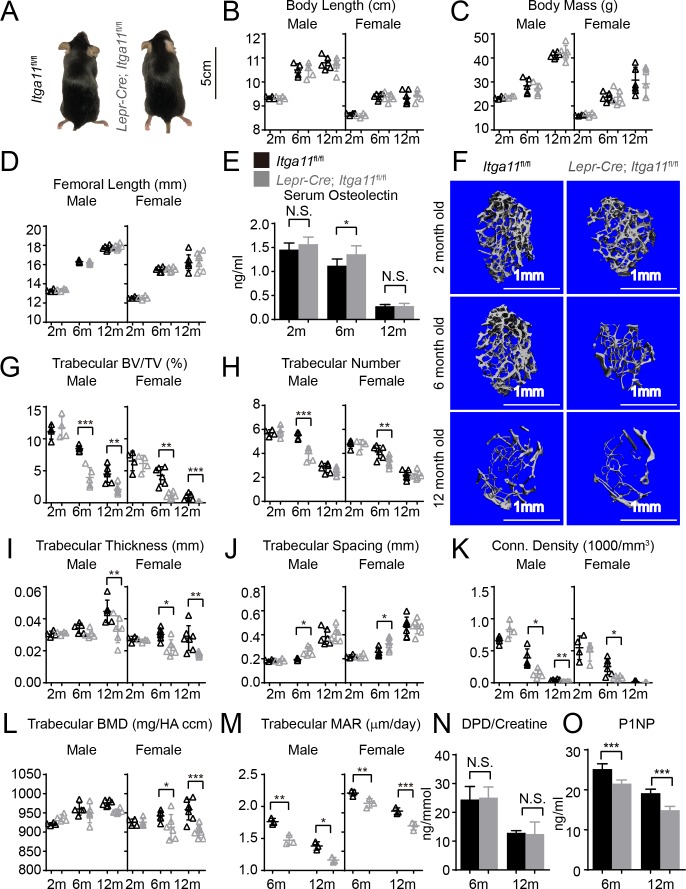
Figure 5. Conditional Itga11 deletion from LepR+cells accelerates the loss of trabecular bone during aging.
(A) Lepr-Cre; Itga11fl/fl mice were grossly normal and indistinguishable from littermate controls. (B – D) Body length (B), body mass (C) and femur length (D) did not significantly differ between Lepr-Cre; Itga11fl/fl mice and sex-matched littermate controls at 2, 6, or 12 months of age (n = 4–7 mice per genotype per sex per time point, from at least three independent experiments). (E) ELISA measurement of serum Osteolectin levels in Lepr-Cre; Itga11fl/fl mice and littermate controls at 2, 6, and 12 months of age (n = 8 mice per genotype per time point from four independent experiments). (F) Representative microCT images of trabecular bone in the distal femur metaphysis of male Lepr-Cre; Itga11fl/fl mice and littermate controls at 2, 6, and 12 months of age. (G–L) microCT analysis of trabecular bone volume/total volume (G), trabecular number (H), trabecular bone thickness (I), trabecular bone spacing (J), connectivity density (K), and bone mineral density (L) in the distal femur metaphysis of Lepr-Cre; Itga11fl/fl mice and sex-matched littermate controls at 2, 6, and 12 months of age (n = 4–7 mice per genotype per sex per time point from at least three independent experiments). (M) Trabecular bone mineral apposition rate based on calcein double labelling in the distal femur metaphysis (n = 3 mice per genotype per sex per time point). (N) Bone resorption rate analysis by measuring the deoxypyridinoline/creatinine ratio in the urine of LepR-Cre; Itga11fl/fl mice and littermate controls at 6 and 12 months of age (n = 4–5 mice per genotype per time point from three independent experiments). (O) Serum P1NP levels in LepR-Cre; Itga11fl/fl mice and sex-matched littermate controls at 6 and 12 months of age (n = 4 mice per genotype per time point from three independent experiments). All numerical data reflect mean ±standard deviation. The statistical significance of differences was determined with two-way ANOVAs with Sidak’s multiple comparisons tests.


