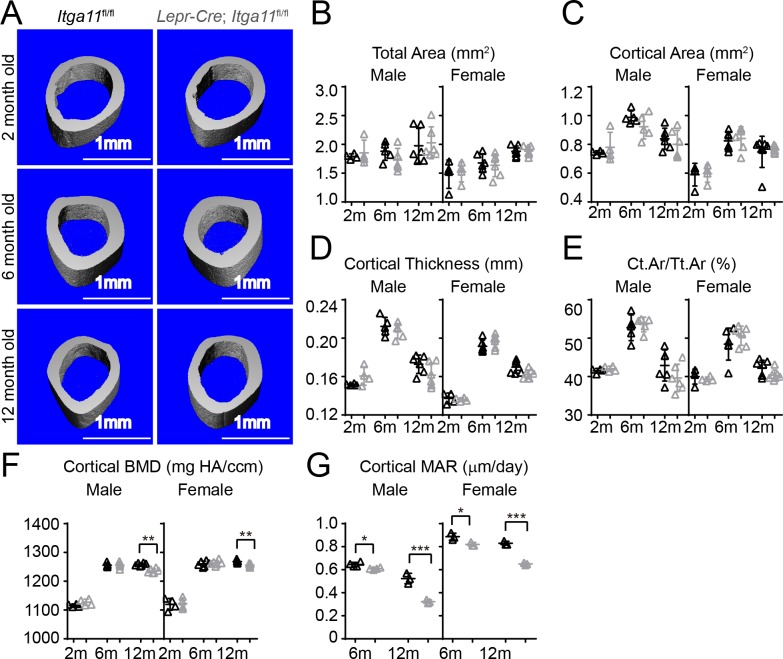
Figure 6. Conditional Itga11 deletion from LepR+cells reduces cortical bone formation in adult mice.
(A) Representative microCT images of cortical bone in the mid-femur diaphysis of male Lepr-Cre; Itga11fl/fl mice and littermate controls at 2, 6, and 12 months of age. (B–F) microCT analysis of the total area (B), cortical area (C), cortical thickness (D), cortical area/total area (E), and cortical bone mineral density (F) in the mid-femur diaphysis of Lepr-Cre; Itga11fl/fl mice and sex-matched littermate controls at 2, 6, and 12 months of age (n = 4–7 mice per genotype per sex per time point from at least three independent experiments). (G) Cortical bone mineral apposition rate based on calcein double labelling in the mid-femur diaphysis (n = 3–4 mice per genotype per sex per time point from three independent experiments). All numerical data reflect mean ±standard deviation. The statistical significance of differences was determined with two-way ANOVAs with Sidak’s multiple comparisons tests.

