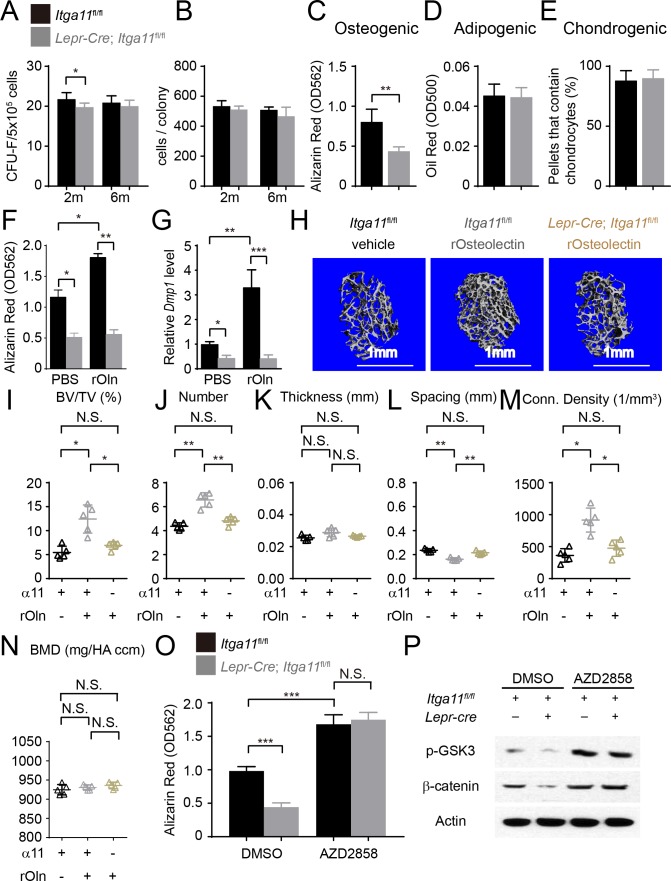
Figure 7. Integrin α11 is required by bone marrow stromal cells to undergo osteogenesis in response to Osteolectin.
(A) CFU-F frequency and (B) cells per CFU-F colony formed by bone marrow cells from Lepr-Cre; Itga11fl/fl mice and littermate controls at 2 and 6 months of age (n = 6–8 mice per genotype per time point from at least three independent experiments). (C–E) Osteogenic (C); n = 7 mice per genotype, total, from seven independent experiments), adipogenic (D); n = 6 mice per genotype, total, from six independent experiments), and chondrogenic (E); n = 5 mice per genotype, total, from five independent experiments) differentiation of bone marrow stromal cells cultured from the femurs of Lepr-Cre; Itga11fl/fl mice and sex-matched littermate controls at 2 months of age. (F) Recombinant mouse Osteolectin promoted osteogenic differentiation in culture by femur bone marrow stromal cells from control but not Lepr-Cre; Itga11fl/fl mice (n = 3 mice per genotype, total, from three independent experiments). (G) qRT-PCR analysis of Dmp1 transcript levels in cells from panel (F). (H–N) Subcutaneous injection of recombinant mouse Osteolectin daily for 28 days (50 μg/kg body mass/day) significantly increased trabecular bone volume and number in female control mice but not female Lepr-Cre; Itga11fl/fl mice. (H) Representative microCT images of trabecular bone in the distal femur metaphysis. (I–N) microCT analysis of trabecular bone volume/total volume (I), trabecular number (J), trabecular thickness (K), trabecular spacing (L), connectivity density (M), and bone mineral density (N) in the distal femur metaphysis (n = 5 mice per treatment, total, from three independent experiments). (O) The GSK3 inhibitor, AZD2858, rescued the osteogenic differentiation in culture of bone marrow stromal cells from the femurs of Lepr-Cre; Itga11fl/fl mice (n = 6 independent experiments in which cells from one mouse of each genotype were cultured in each experiment). (P) Western blotting of cultured cell lysates showed that AZD2858 promoted GSK3 phosphorylation and increased β-catenin levels in bone marrow stromal cells from Lepr-Cre; Itga11fl/fl mice and littermate controls. All numerical data reflect mean ±standard deviation. The statistical significance of differences was determined with Wilcoxon’s test followed by Holm-Sidak multiple comparisons adjustment (A and B), one-way (F), (G,) and O) ANOVAs with Sidak’s multiple comparisons tests, by paired t-tests (C–E), or by one-way ANOVAs with Tukey’s multiple comparisons tests (I–N).


