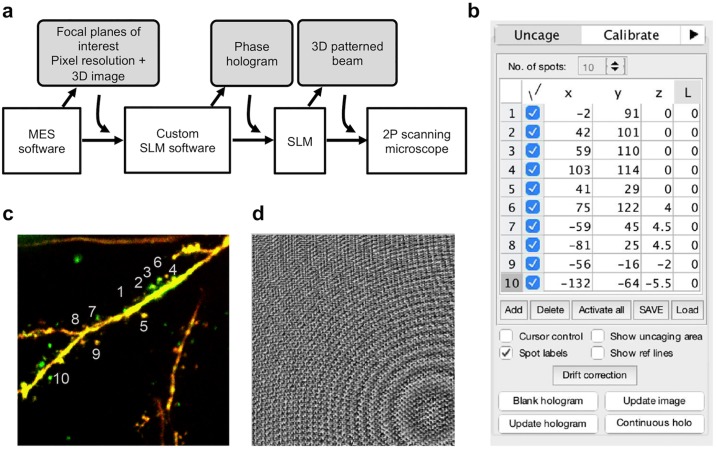
Fig 2. Software control of holographic projector.
a: Interfacing between our custom SLM software and the rest of the system including the microscope’s control software (MES), which gathers the pixel resolution. b: Custom software graphical user interface showing xyz-coordinates of uncaging spots. We use the last column to encode a Laguerre-Gaussian beam of charge “L” to align the center of the SLM with respect to the optical axis. c: Two-photon 3D image of a basal dendrite with multiple spines. Positions of uncaging sites in b are indicated. d: The corresponding 8-bit phase-only hologram for projecting the multiple uncaging spots in b.

