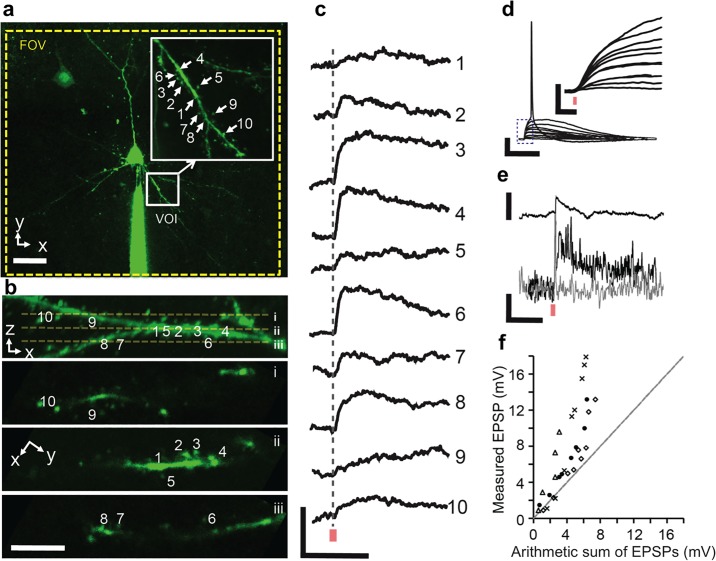
Fig 4. Representative synaptic integration experiment.
a: Two-photon image of a layer 2/3 pyramidal neuron labeled with OGB-1 taken with a 60× objective. Inset shows a high-magnification flattened multi-stack image of the VOI. Scale bar: 20 μm. b: VOI displayed as an xz-image with 3 representative image planes (i: z = −5 μm; ii: z = 0; and iii: z = + 5 μm. Scale bar: 5 μm. c: Somatic EPSPs of individual uncaging events (red bar indicates time point of 2P glutamate uncaging). Scale bars: 1 mV, 40 ms. d: Uncaging responses with increasing number of simultaneous uncaging sites. Scale bars: 20 mV, 50 ms. (Inset) Magnified EPSP rise times for increasing number of uncaging sites. Scale bars: 5 mV, 5 ms. e: Representative individual uncaging-evoked EPSP (top) and Ca2+ transient (ΔF/F) (bottom) measured at spine 4 (black) and nearby dendrite (gray). Scale bars: 2 mV, 20%, 500 ms. f: Input-output plot (n = 4) of measured multisite uncaging response against the arithmetic sum of individual uncaging events. Dashed line indicates linear summation, black circles represent data from a while all other markers represent data from other experiments.

