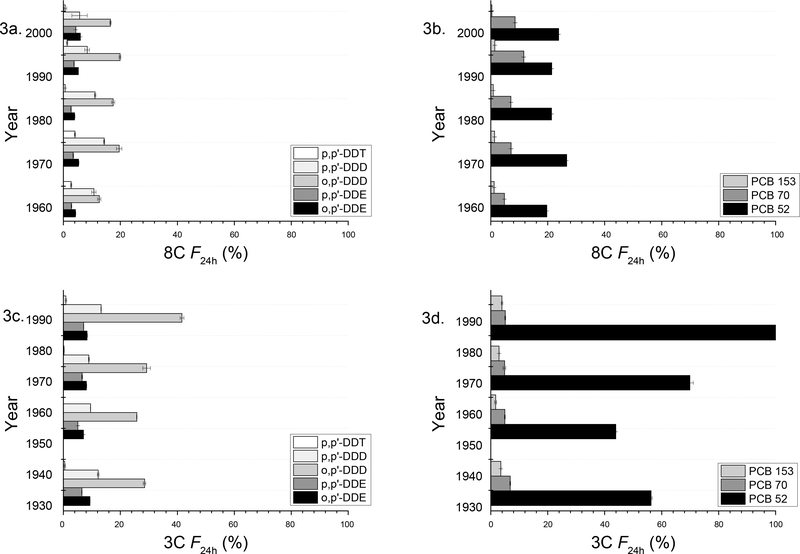
Figure 3.
Average values of the 24-h desorbable fraction of HOCs (F24h) from the 3C and 8C cores versus sediment age. Average values of F24h were calculated using the average 24-h desorbable concentrations (S24h) for each section and dividing that by the average total concentration (CT). Error bars represent the first standard deviation from the mean.

