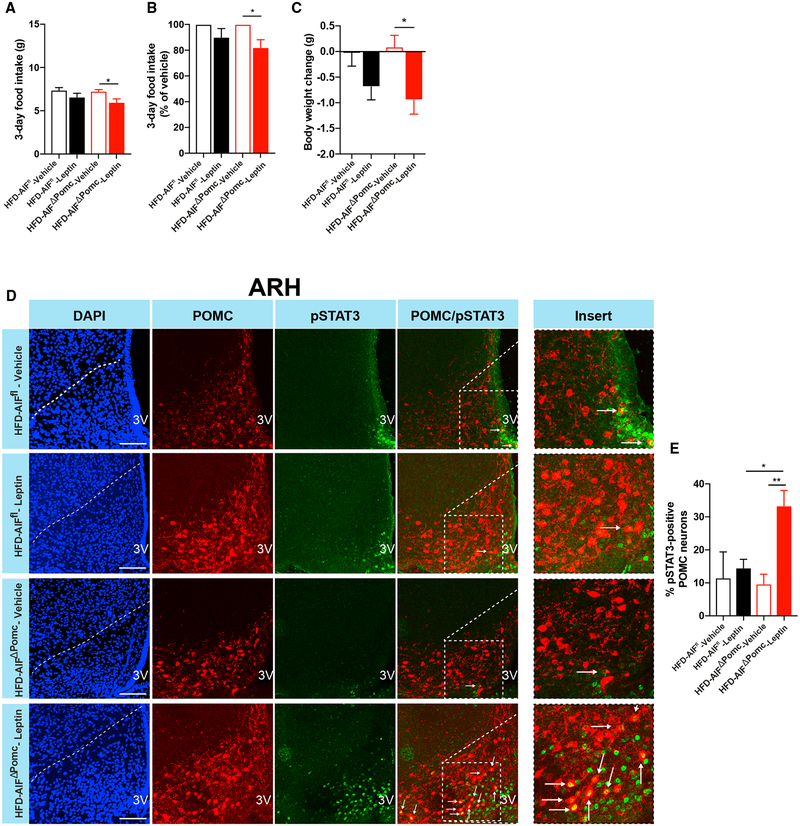
Figure 2. AIF Deficiency in POMC Neurons Enhances Leptin Sensitivity in Obesity.
(A–C) Absolute (A) and percentage of (B) 3-day food intake and body-weight change (C) of HFD-fed obese AIFΔPOMC and AIFfl control mice after 3 days of twice daily intraperitoneal injection of leptin (2 mg/kg) versus vehicle (0.1 M PBS) (n = 7–9 per group).
(D and E) Representative confocal images (D) and quantification (E) of pSTAT3-immunoreactive POMC neurons (pSTAT3, green; POMC, red) and corresponding nuclear counterstaining (DAPI, blue) in the ARH of 16-hr-fasted HFD-fed AIFΔPOMC and AIFfl control mice 45 min after i.p. injection of leptin (2 mg/kg) versus vehicle (0.1 M PBS) (n = 3–6 per group).
Scale bars, 100 μm; 3V, third ventricle. Data are represented as mean ± SEM. *p ≤ 0.05 and **p < 0.01 as determined by two-way ANOVA followed by Bonferroni post hoc test. See also Figure S3.

