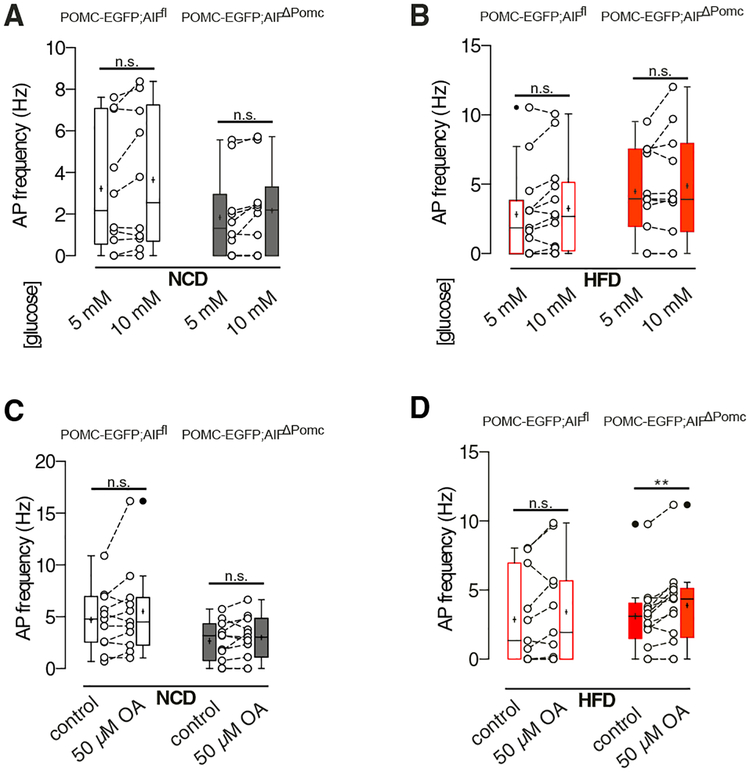
Figure 4. AIF Deficiency in Obesity Increases Fatty Acid Sensing of POMC Neurons.
(A and B) Action potential (AP) frequency during low (5 mM) and high (10 mM) glucose concentrations in POMC neurons from NCD-fed (n = 10 versus 10) (A) and HFD-fed (n = 13 versus 11) (B) AIFΔPOMC and AIFfl control mice.
(C and D) AP frequency in POMC neurons upon bath application of oleate (OA) from NCD-fed (n = 11 versus 11) (C) and HFD-fed (n = 11 versus 13) (D) AIFΔPOMC and AIFfl control mice. Data are presented as mean ± SEM. The mean is depicted as horizontal line, the median is depicted as +. **p ≤ 0.01 as determined by two-tailed, paired Student’s t test.

