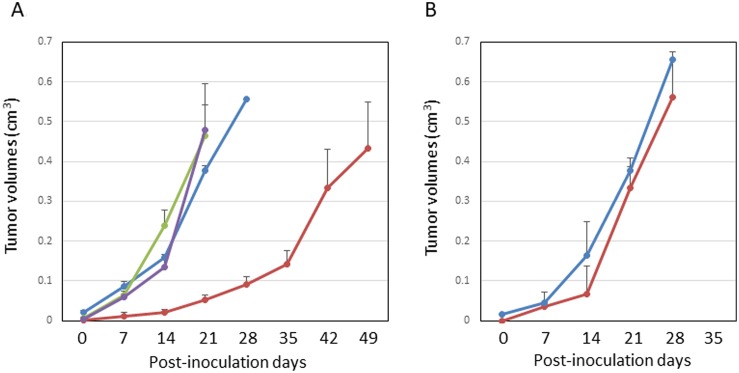
Figure 3. Growth suppression in the rat glioblastoma model.
(A) Line graphs of the intracerebral tumor volume measured by serial MRIs at each week in the immunocompetent F344 rats. The blue line indicates the non-treated control (Group A, n = 3), The green line indicates treatment with LP-iDOPE injection alone (Group B, n = 4), the purple line indicates treatment with hyperthermia alone at 45° C (n = 3), and the red line indicates treatment with LP-iDOPE injection and NIR irradiation (Group C, n = 6). (B) Line graphs of the intracerebral tumor volume measured with serial MRIs at each week in the immunodeficient rats (nude rats). The blue line is non-treated control (n = 1), and the red line is treated with LP-iDOPE injection and NIR irradiation (n = 3). The bars indicate the standard error of the mean.

