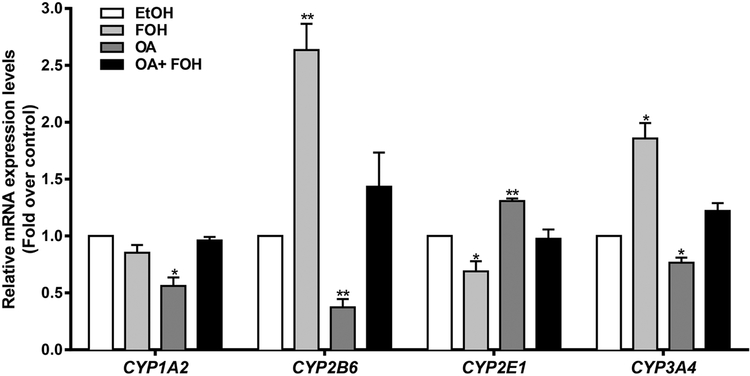
Figure 6. Effects of FOH on CYP expression in HepaRG cells.
HepaRG cells were pre-treated for 24 hours with HepaRG treatment medium containing FF-BSA alone or complexed with 0.66 mM OA. The cells were then incubated for 48 hours (media change after 24 hours) in pre-treatment medium (i.e., FF-BSA or OA) containing either 0.1% EtOH or 100 μM FOH. Cells were then harvested, and CYP mRNA levels were quantified by RT-qPCR, as described in Materials and Methods. Each bar represents the mean ± SEM of normalized mRNA levels from 3 independent experiments (n=3), and within each experiment data were normalized to the EtOH-treated control group (i.e., EtOH=1). *Significantly different from 1, P<0.05, **P<0.01.

