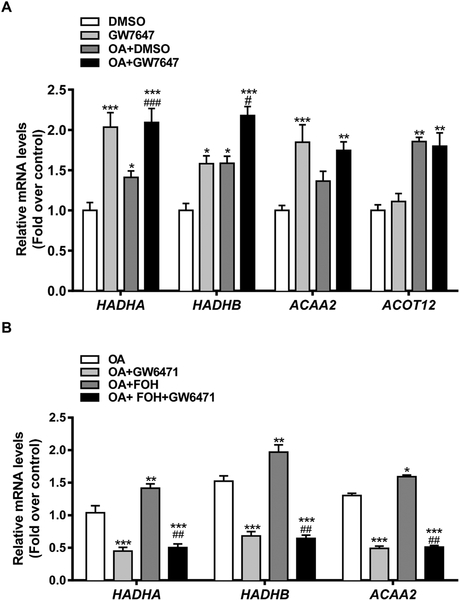
Figure 7. Role of PPARα in FOH-mediated regulation of mitochondrial fatty acid β-oxidation genes in HepaRG cells.
(A) HepaRG cells were cultured in HepaRG treatment medium containing either 0.1% DMSO, 10 μM GW7647, FF-BSA complexed with 0.66 mM OA+DMSO, or 0.66 mM OA+10 μM GW7647 for 48 hours. Treatments were replaced once after 24 hours. Cells were then harvested, and mRNA levels of fatty acid oxidation genes were quantified by RT-qPCR. Each bar represents the mean ± SEM of mRNA levels normalized to the DMSO-treated control group from 3 (HADHB, ACAA2; n=3) or 4 (HADHA, ACOT12; n=4) independent experiments. *Significantly different from DMSO-treated group, P<0.05, **P<0.01, ***P<0.001.#Significantly different from OA+DMSO-treated group, P<0.05,###P<0.001. (B) HepaRG cells were pre-treated for 24 hours with HepaRG treatment medium containing FF-BSA complexed with 0.66 mM OA, followed by treatment for 48 hours (media change after 24 hours) with medium containing 0.66 mM OA, either alone or in combination with 100 μM FOH, 10 μM GW6471, or FOH+GW6471. Cells were then harvested, and mRNA levels of mitochondrial fatty acid β-oxidation genes were quantified by RT-qPCR. Each bar represents the mean ± SEM of mRNA levels normalized to the OA-treated group from 3 (HADHA, ACAA2; n=3) or 4 (HADHB; n=4) independent experiments. *Significantly different from OA-treated group, P<0.05, **P<0.01, ***P<0.001.##Significantly different from OA+FOH-treated group, P<0.01.

