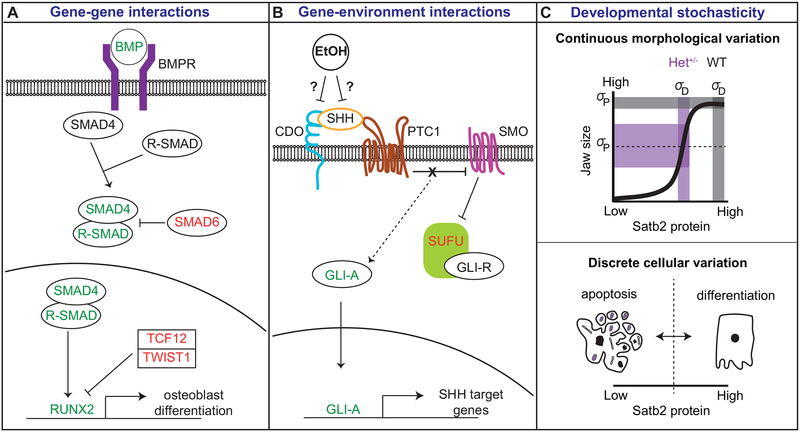
Figure 2: Mechanisms regulating variation in developmental processes.
Factors contributing to variation in developmental processes include A) gene-gene interactions, B) gene-environment interactions, and C) developmental stochasticity. A) Gene-gene interactions are modeled by BMP signaling in osteogenesis. Proteins in red are negative regulators of the pathway; proteins in green are positive regulators. Heterozygous mutations in SMAD6, a negative regulator of the BMP pathway, may be buffered if they occur in isolation. However, if they occur in a “risk allele” background in which BMP levels are increased or a second negative regulator (e.g., TCF12) is decreased, disease phenotypes are observed. Image modeled after Timberlake et al. 2018. B) Gene-environment interactions are modeled by ethanol (EtOH) influences on SHH signaling. EtOH may exacerbate mutations in CDO, a SHH co-receptor, by negatively interacting with SHH binding to its receptors. Image modeled after Kahn et al. 2016. C) Developmental stochasticity is modeled by Satb2-mediated variation in jaw size. Satb2 protein levels have a non-linear relationship with jaw size, where wild-type and homozygous mutant individuals exhibit little population variance in size (grey shaded rectangles). However, heterozygous mutants are highly variable in size, encompassing the range of variation between wild-type and mutant (purple shaded rectangles). This continuous morphological variation (upper panel) can be explained by discrete cellular variation (lower panel). Satb2+/− cells are predicted to generate Satb2 protein levels that are at or near the threshold for Satb2 activation. Those cells that meet or surpass the threshold will proliferate and differentiate into osteoblasts; those cells that fall below the threshold will undergo apoptosis. Thus, random variation in the degree of heterogeneity in cell fate between individuals can explain variation in jaw size. Dotted lines indicate threshold for protein activity.

