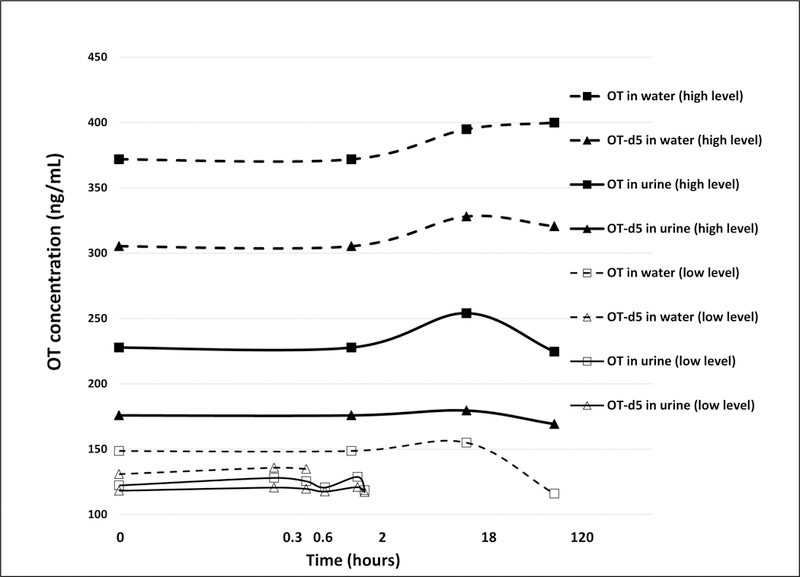
Figure 5.

Changes of OT and OT-d5 over time at different initial concentrations in water and in urine. Measured levels differed slightly from theoretical spike amounts due to deviations from the calibration curve (RSD≤4.3%). X-axis is on a log scale.
