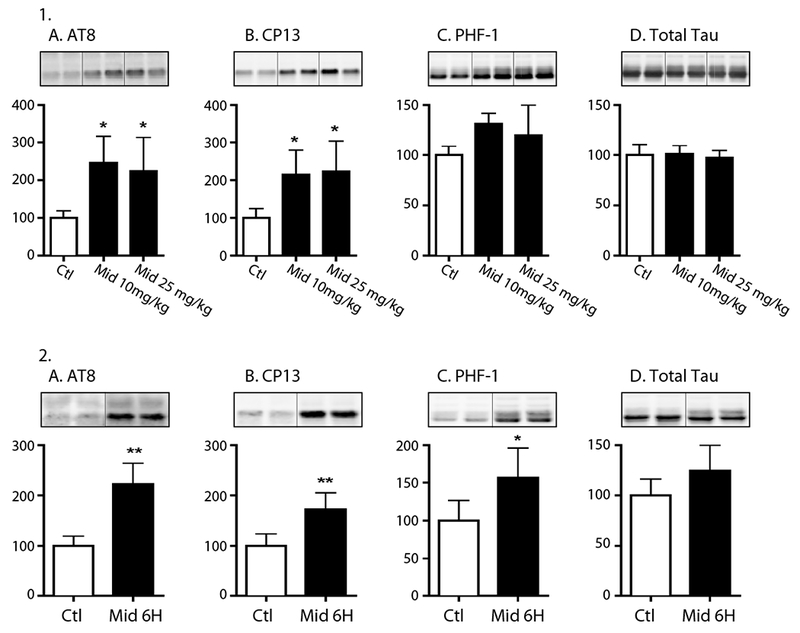
Figure 1. Acute of administration of midazolam increases hippocampal tau phosphorylation in C57BL/6 mice.

1. Hippocampal tau phosphorylation (% Ctl) at the AT8 (pSer202/pThr205), CP13 (pSer202), and PHF-1 (pSer396/Ser404) phosphoepitopes (1A-C) in 8-10-week-old C57BL/6 treated with midazolam (Mid) 10 mg/kg (n = 5) or 25 mg/kg (n = 5) i.p. Control (Ctl) mice (n = 4) were treated with 0.9% saline (100 μL per 10 g of body weight). All mice were sacrificed 30 min after treatment. No statistically significant difference in rectal temperatures (°C) was observed at the time of tissue harvest: Ctl 37.4 ± 0.3°C, Mid 10 mg/kg 37.3 ± 0.3°C, and Mid 25 mg/kg 37.4 ± 0.2°C. 2. Hippocampal tau phosphorylation (% Ctl) at the AT8, CP13, and PHF-1 phosphoepitopes (2A-C) in 8-10-week-old C57BL/6 mice treated with midazolam 25 mg/kg (MID 6h, n = 5) or 0.9% saline (Ctl, n = 4) i.p. and sacrificed 6h later. Normothermia was maintained throughout the study and rectal temperatures were similar at the time of hippocampal tissue harvest: Ctl 36.4 ± 0.3°C and MID 6h 36.9 ± 0.2 °C. Phosphorylated tau was normalized to total tau (1D and 2D) after controlling for gel loading with β-actin. Relative immunoreactive band intensities are expressed as a percent of Ctl and are displayed for each phosphoepitope and total tau. For each condition, 2 representative immunoblot bands are displayed. Data are expressed as mean ± SD and were analyzed using ANOVA with Tukey’s post-hoc test. * and ** denote P < 0.05 and P < 0.01 vs. Ctl, respectively.
