
Figure 2. TNF-α detection in microtiter plates.
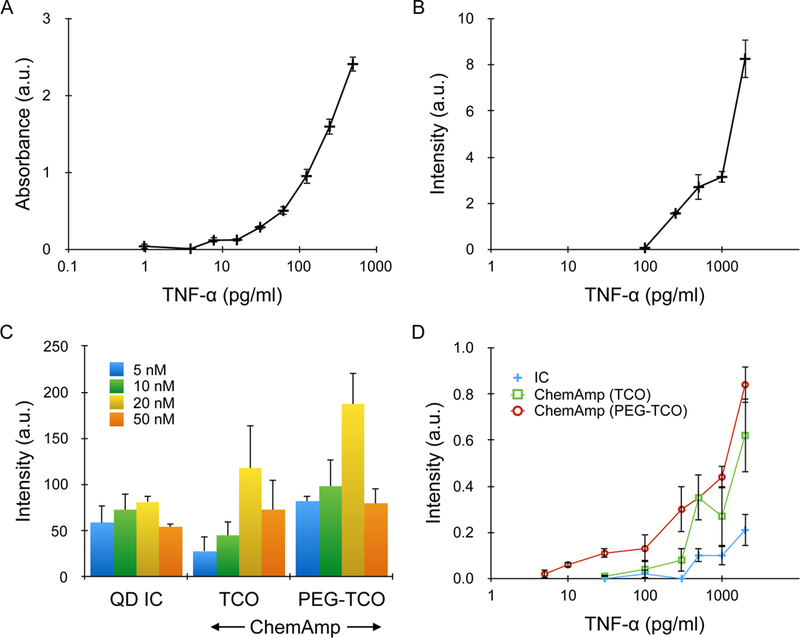
(A) ELISA results performed using biotinylated detection antibody, avidin-HRP, and TMB substrate. Detection threshold, defined as the lowest TNF-α concentration at which signal was significantly above background, was ~5 pg/ml, or 300 fM. (B) Standard immunofluorescence assay performed using rhodamine-labeled detection antibody (TMR), with detection threshold at ~300 pg/ml, or 18 pM. (C) QD results for an IC, as well as the ChemAmp technique using TCO and PEG-TCO modified detection antibodies. TNF-α concentration was 500 pg/ml, and the maximum signal was obtained at 20 nM QD concentration for all cases. The decrease at 50 nM was due to higher background. (D) QD intensities for all 3 detection formats as a function of TNF-α concentration. Detection thresholds were 100 pg/ml (6 pM) for the IC, 30 pg/ml (2 pM) for ChemAmp with TCO-modified detection antibody, and 3 pg/ml (180 fM) for ChemAmp with PEG-TCO-modified detection antibody. All results were background subtracted using the signal obtained from nonspecific QD binding. Error bars represent the standard error from at least three independent experiments.