
Figure 4. Single cell secretion results.
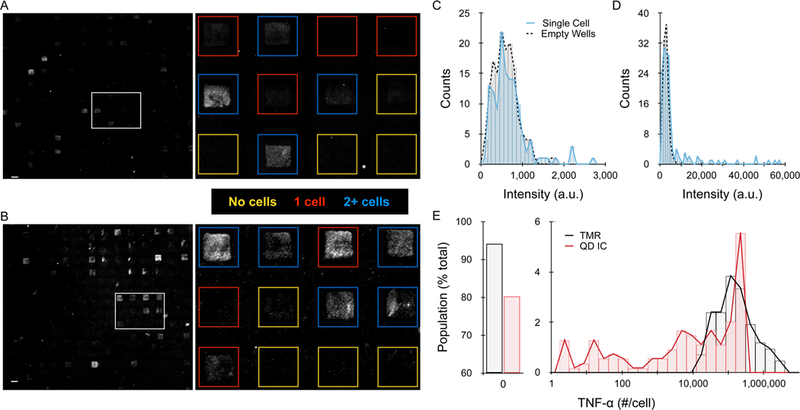
(A,B) Representative detection slide images for (A) TMR and (B) QD IC formats. The dashed box indicates the region that was expanded to the right, with individual wells outlined and color coded based on the presence of 0 (yellow), 1 (red), or multiple (blue) cells as determined by phase contrast imaging. (C,D) Histograms of average well intensity for (C) TMR and (D) QD IC from a representative experimental replicate. Empty well results are indicated by the dotted black line to establish background signals. (E) Histogram of single cell detection results after calibrating TNF-α secretion per cell. Single cells had to secrete >10,000 molecules for detection with TMR, but the QD IC enabled detection down to ~1.3 molecules secreted per cell. Scale bars are 100 μm.