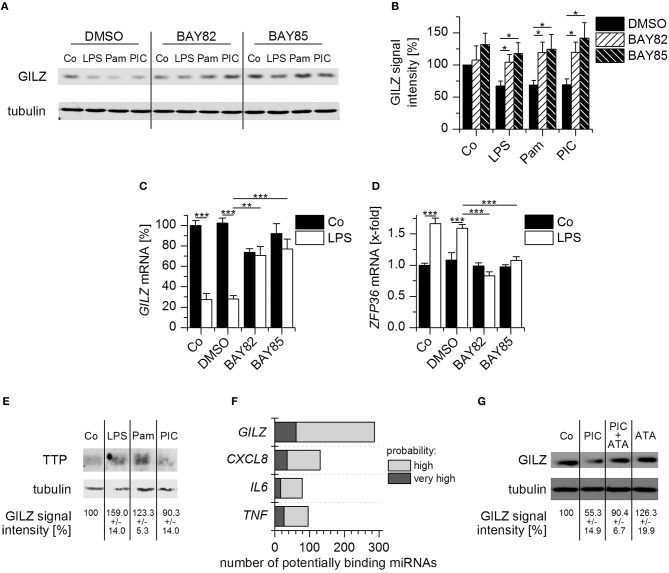
Figure 5.
Mechanisms of GILZ downregulation upon TLR activation. (A,B) AMs pretreated with BAY-11-7082 (BAY82, 5 μM), BAY-11-7085 (BAY85, 5 μM), or the solvent control DMSO (0.1%) for 1 h, followed by treatment with LPS (100 ng/mL), Pam3CSK4 (Pam, 1 μg/mL), Poly(I:C) (PIC, 10 μg/mL), or medium (Co) for 4 h. GILZ expression was determined by Western blot. Tubulin served as a loading control. (A) Representative blot. (B) GILZ signal intensities were quantified and normalized to tubulin values (n = 7). Values for unstimulated DMSO controls were set as 100%. (C,D) After preincubation with BAY-11-7082 or BAY-11-7085 (5 μM, 1 h), solvent (0.1% DMSO) or medium only (Co), AMs were treated with LPS (100 ng/mL) for 2 h. GILZ and ZFP36 mRNA expression was determined by qRT-PCR using ACTB as a housekeeping gene (n = 3, duplicates). (E) AMs were either left untreated (Co) or treated with LPS (100 ng/mL), Pam3CSK4 (Pam, 1 μg/mL), or Poly(I:C) (PIC, 10 μg/mL) for 4 h. TTP levels were determined by Western blot using tubulin as a loading control. GILZ signal intensities were normalized to tubulin and are shown as a percentage of untreated cells (n = 2, triplicates). (F) The number of miRNAs predicted to target GILZ, CXCL8, IL6, and TNF was assessed via the microRNA Data Integration Portal (mirDIP, accession date 02/02/2018). (G) AMs were either left untreated (Co) or treated with Poly(I:C) (PIC, 10 μg/mL), aurintricarboxylic acid (ATA, 25 μM), or a combination of both for 8 h. GILZ expression was quantified by Western blot. Signal intensities were normalized to tubulin and expressed as a percentage of untreated cells (n = 3). *p < 0.05, **p < 0.01, ***p < 0.001.

