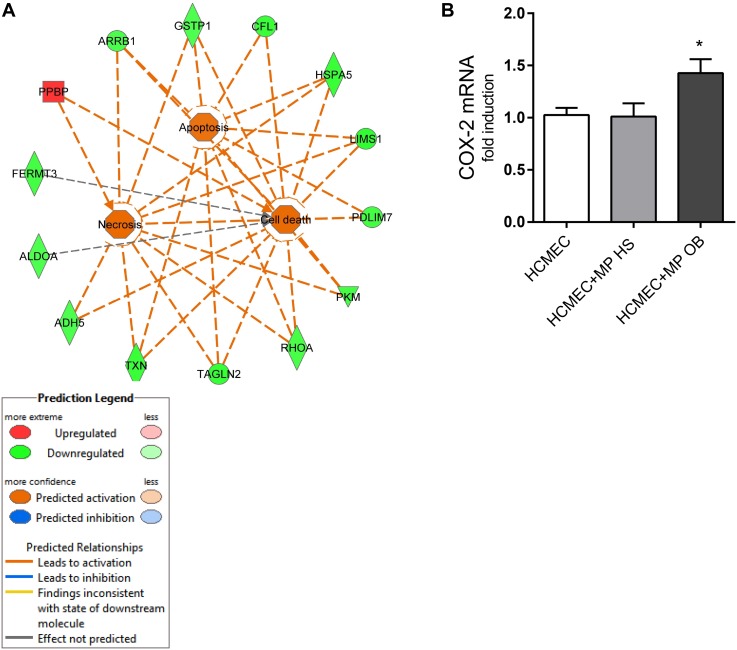
FIGURE 10.
(A) Pathway analysis of modulated MP proteins obtained with IPA for “apoptosis and cell death” signaling is reported. IPA analysis showed regulatory relationships between down-regulated (green) and upregulated (red) proteins; the Molecular Activation Prediction tool showed that “apoptosis, cell death, and necrosis” are positively regulated in obese subjects (orange lines); gray line indicates that the effect is not predicted. (B) In co-culture experiment of HCMEC (0.25 × 10⁶) and platelet MPs from OB and HS individuals (0.25 × 10⁸) for 24 h, the gene expression of COX-2 was evaluated by qPCR, normalized to GAPDH levels as control, and expressed as fold-change. Data are reported as mean ± SEM (n = 4 for each experimental condition); ∗P < 0.05 vs. HCMEC cultured alone.

