FIGURE 6.
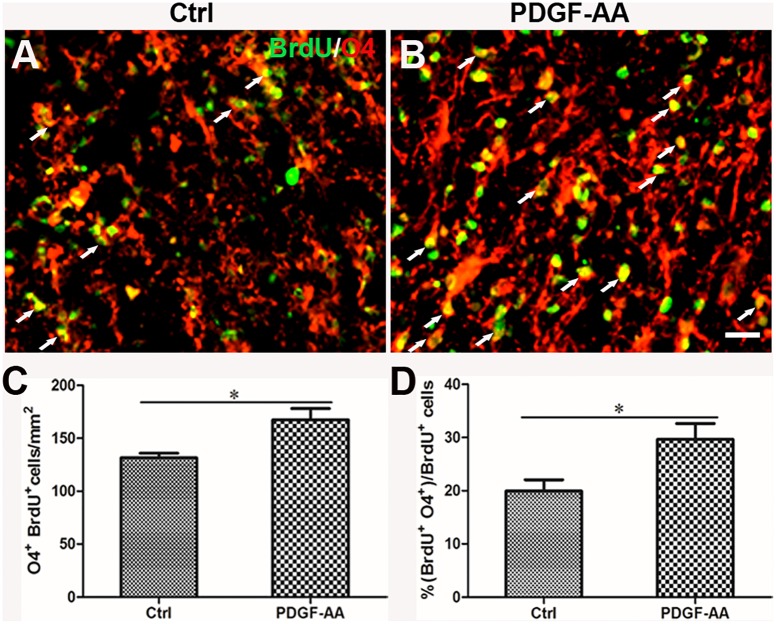
Survival of OLs in the injured spinal cord after SCI, as determined by activated caspase-3 staining. (A,B) Representative photomicrographs showing caspase-3+cells (red) co-localized with CNP+OLs (green) in the circumambience of the injured spinal cord of rats at 2 weeks post-SCI. (C,D) Quantitative analysis of OL survival showing that both the number and percentage of caspase-3+OLs were higher in rats that received PDGF-AA versus controls. Data represent the mean ± SD (n = 8). ∗P < 0.05. Scale bar = 20 μm.

