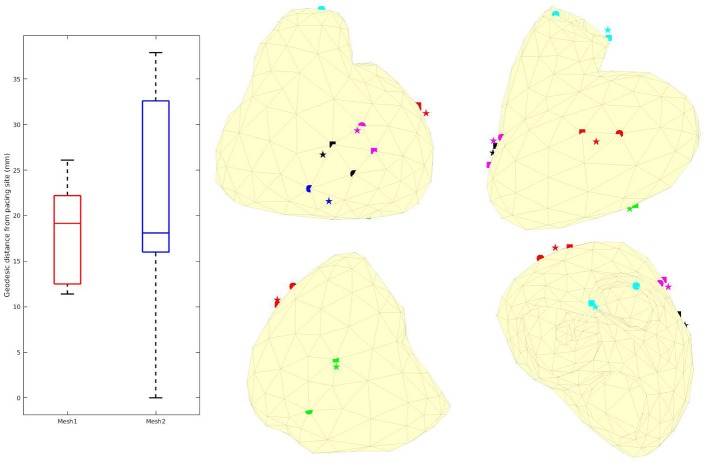
Figure 12.
Left: Box plots of the geodesic distances between actual and identified pacing sites. Middle and right: actual (sphere), identified with Mesh1 (pentagram) and Mesh2 (square) pacing locations. Red: case 1, blue: case 3, green: case 4, black: case 5, cyan: case 6, magenta: case 7. We obtained a p-value of 0.74.

