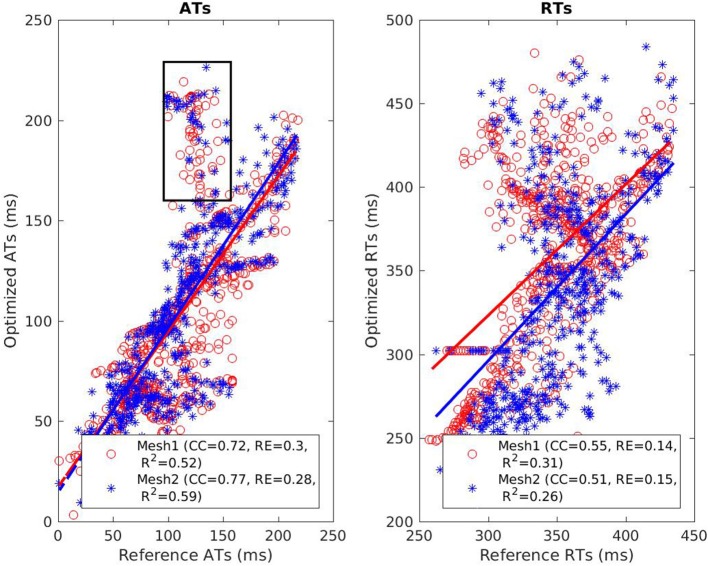
Figure 5.
Scatter plot of the ATs (left) and RTs (right) for the RV pacing case. For each point, the x coordinate is the reference AT (resp. RT) and the y coordinate is the corresponding reconstructed AT (resp. RT). The dashed lines represent the linear fitting. The black box on the left exhibits ATs that were badly reconstructed with both meshes.

