Figure 6.

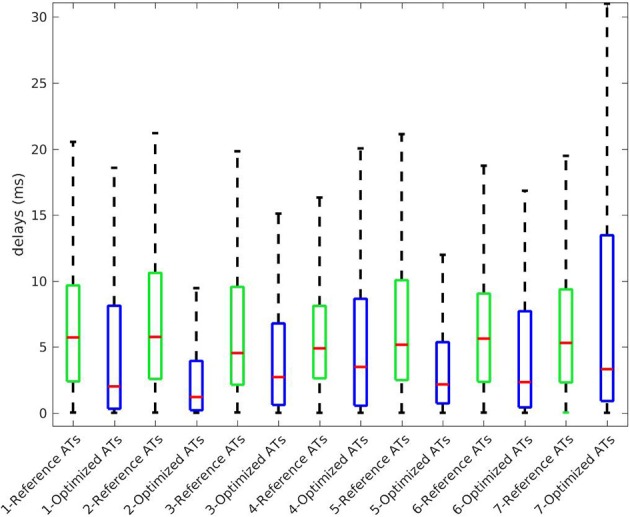
Delays in ATs between endocardium and epicardium for the 7 cases. Box plot represent the median and the first and third quartiles. Whiskers represent the extreme values. Optimized ATs are AT given by the inverse method with Mesh2.

Delays in ATs between endocardium and epicardium for the 7 cases. Box plot represent the median and the first and third quartiles. Whiskers represent the extreme values. Optimized ATs are AT given by the inverse method with Mesh2.