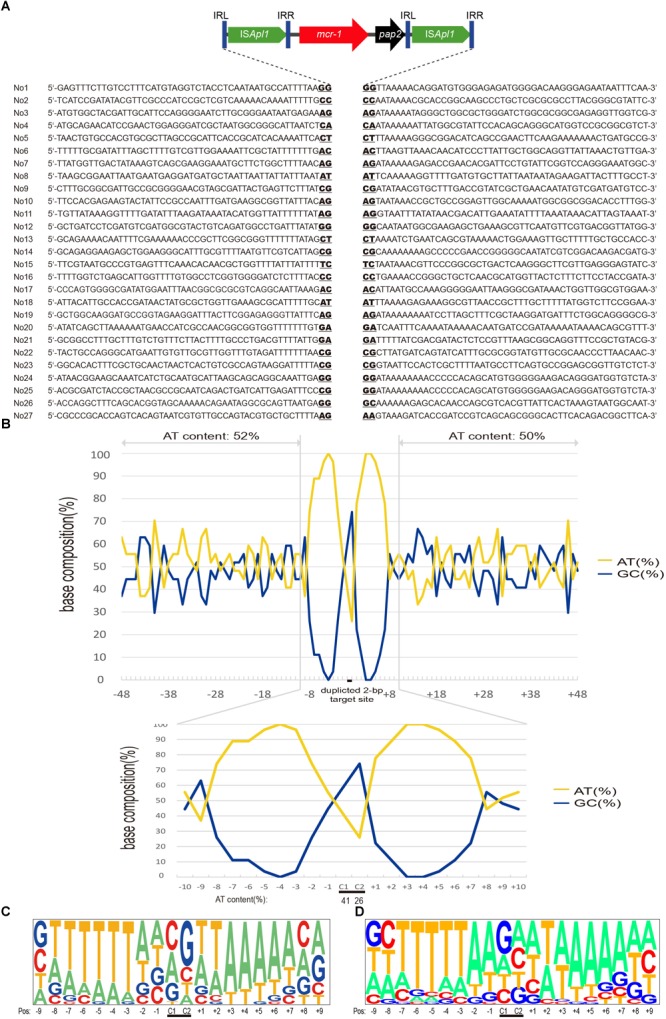
FIGURE 3.

Target site analyses of Tn6330 transposons. (A) Molecular characterization of 27 transposition events of Tn6330 transposons in E. coli MG1655 (recA::Km). The duplicated 2-bp target site is underlined in the context of the surrounding 48 nucleotides upstream and downstream of the target sites. (B) Statistical( analyses of the 27 transposition sites. The percentage of AT and GC at each position from 48 nucleotides upstream to 48 nucleotides downstream of the target site are shown. The 2-bp duplicated target site (c1 and c2) are indicated by black bars. The AT and GC percentages of regions spanning positions –48 to –3 and positions +3 to +48 and that of the region spanning positions –2 to 2 are indicated in the upper and lower graphs, respectively. Relative nucleotide frequencies at each target site deduced from the (C) 27 experimental transposition events shown in (A) and (D) from 26 Tn6330 transposons in clinical isolates obtained from GenBank (Supplementary Table S2).)
