Figure 3.
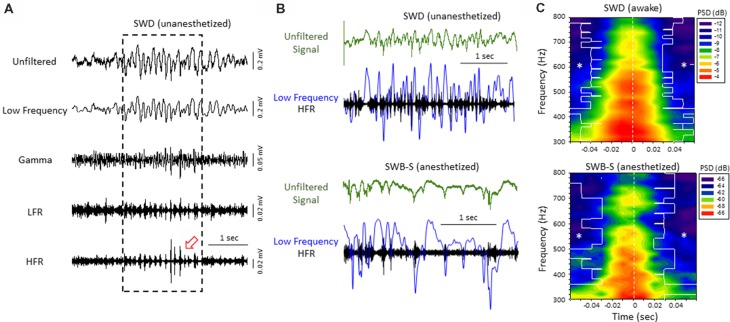
High-frequency ripple (HFR) activity recorded from the iS1 cortex was locked to high-amplitude spike deflections observed in the low frequency band of both awake and anesthetized animals. (A) Example of a spontaneous SWD (awake) from the iS1 cortex and corresponding HFOs. Each signal was digitally filtered into spectral bandwidths for comparison as defined in Figure 1. Strong wax-and-wane amplitude oscillations (red arrow head) were commonly observed across the HFR spectrum locked to the large amplitude spike deflections of the SWD. (B) Representative traces from freeze lesion animals indicating that the oscillatory amplitude changes observed in the HFR band were locked to the spike-and-wave pattern of the low frequency band during both spontaneous SWDs (upper panel) and spike-wave burst-suppression (SWB-S) events (lower panel). In each example an overlay of the low frequency (blue trace) and HFR (black trace) bands are presented below each unfiltered trace (green) for comparison. (C) Average perievent spectrograms indicating that the increases in PSD within the HFR frequency band were centered on the “spike” of the spike-and-wave pattern that occurred during either SWDs (upper panel, n = 5) or B-S events (lower panel, n = 6). SWDs were recorded from the iS1 region of awake animals while the B-S events shown were recorded from the supragranular layer of the iS1 region of anesthetized animals. *P < 0.05 compared to PSD values at time 0 for each frequency bin (Holm-Sidak post hoc analysis).

