Figure 4.
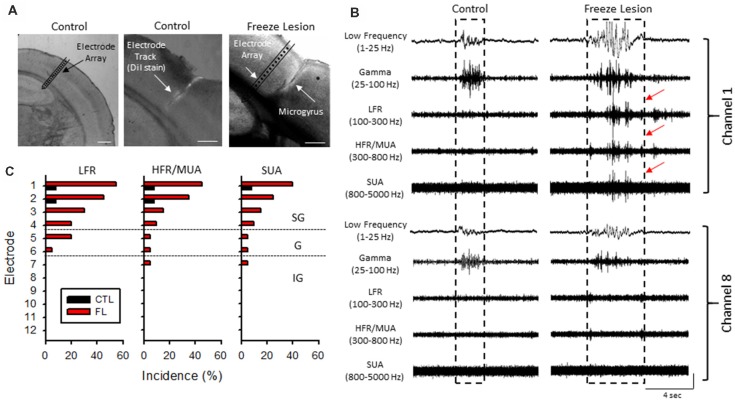
Band-pass filter analysis of linear array recordings indicated an increase in HFOs during periods of B-S in freeze lesion animals in the upper cortical layers of the malformed cortex. (A) Representative coronal sections from the S1 cortical region of control and freeze lesion animals. Left panel indicates orientation of the linear micro-electrode array in comparison to the S1 cortex. The first 12 electrodes spanned the vertical extent of the cortex. Middle panel indicates the micro-electrode recording track as indicated by fluorescent DiI labeling of the linear array. Right panel demonstrates a freeze lesion induced microgyrus as compared to the position of a micro-electrode array. White scale bars = 400 μm. (B) Representative samples of B-S events recorded from channels 1 and 8 of a control and freeze lesion animal. The waveforms were digitally filtered to evaluate spectral changes across defined bandwidth ranges; low-frequency, gamma, low-frequency ripple (LFR), HFR, and multi-unit activity (MUA). Increases in HFOs above 100 Hz were largely confined to the upper cortical layers near the site of the freeze lesion injury (red arrows). Amplitude scale bar = 0.4 mV (unfiltered signals) and 0.04 mV (filtered signals). Amplitude of filtered signals was increased to show detail of high-frequency events. (C) Percent of recordings exhibiting increases in HFOs between control and freeze lesion animals across three frequency bands. Electrodes 1–12 represent recordings from the upper to lower regions of the cortex, respectively. SG, supragranular; G, granular; IG, infragranular.

