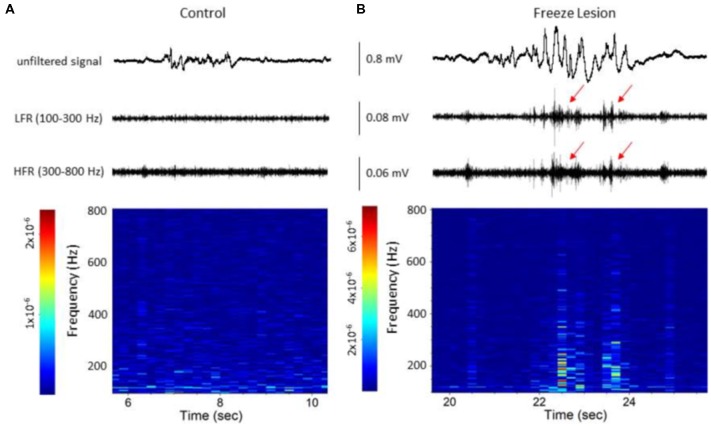
Figure 5.
Spectrograph analysis of B-S events demonstrating the increase in high-frequency spectral power that was observed during the HFOs. (A) B-S event from a control animal indicating a lack of HFOs (i.e., LFR and HFR, upper panel) and minimal change in high-frequency spectral power (spectrograph, lower panel). (B) B-S event from a freeze lesion animal indicating the presence of HFOs (red arrows, upper panel) and subsequent increase in high-frequency spectral power (spectrograph, lower panel). (A,B) The corresponding signal is presented above each spectrograph. Recordings are representative samples from the most superficial linear array electrode (CH01) of both a control and freeze lesion animal. Scale bar represents the PSD (dB) level for each spectrotemporal subunit.

