Figure 3.
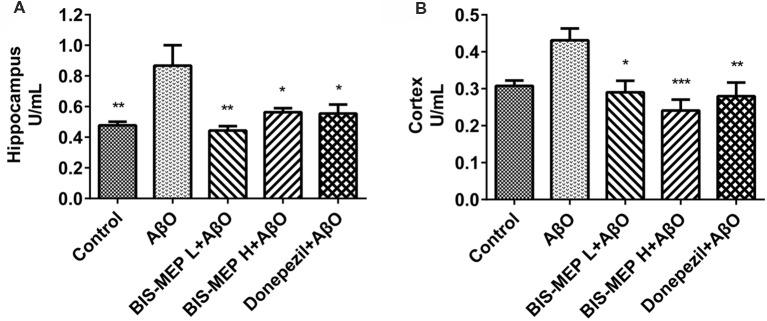
Effects of BIS-MEP on the cholinergic system in the brains of AD model mice. The acetylcholinesterase (AChE) activity in the hippocampus (A) and cortex (B) is shown in the bar graph. Bars in the chart represent the means ± SEM for each group (n = 5). Significant differences between the AD model group and other groups are indicated by asterisks. *P < 0.05, **P < 0.01, and ***P < 0.001.

