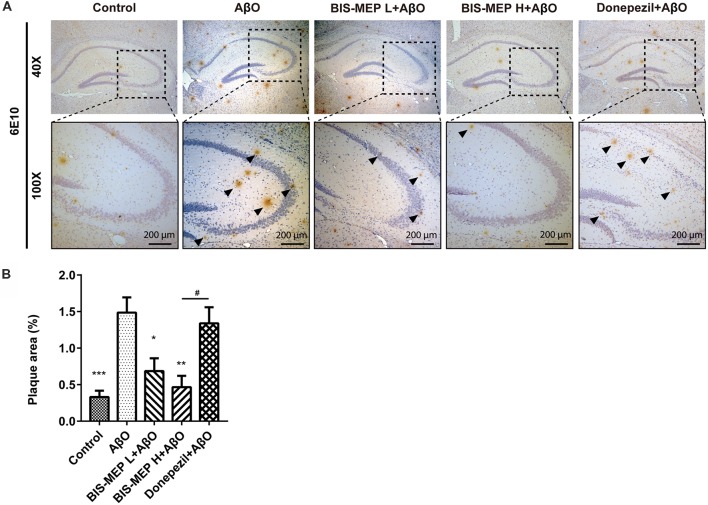
Figure 4.
Effects of BIS-MEP on β-amyloid (Aβ) plaques in the brains of AD model mice. (A) Images of immunohistochemical staining for Aβ deposition in representative sections of the hippocampus from each group (40× magnification). Aβ was labeled with the 6E10 antibody. Aβ plaques are marked with black triangles. Representative images captured at 100× magnification are shown for specification. (B) The quantitative analysis of the percentage of Aβ plaque areas. Image-Pro Plus software was used to semi-quantitatively measure the percentage of plaque areas. Bars in the chart represent the means ± SEM for each group (n = 7–10). Significant differences between the AD model group and other groups are indicated by asterisks, and differences between BIS-MEP H group and Donepezil group are indicated by the pound sign. *P < 0.05, **P < 0.01, ***P < 0.001, and #P < 0.05.

