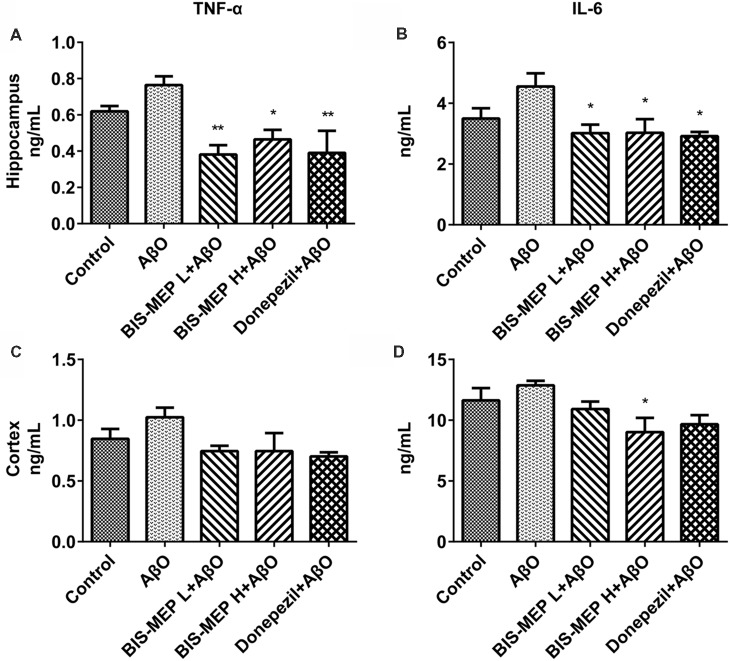
Figure 6.
Effects of BIS-MEP on TNF-α and IL-6 levels in the brains of AD model mice. TNF-α (A,C) and IL-6 (B,D) levels in the hippocampus (upper panel) and cortex (lower panel) are shown in bar graphs. Bars in the chart represent the means ± SEM for each group (n = 5). Significant differences between the AD model group and other groups are indicated by asterisks. *P < 0.05 and **P < 0.01.

