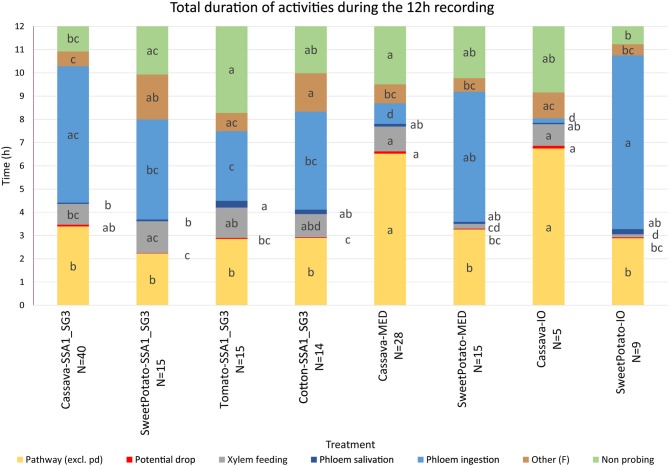
Figure 3.
Total duration of activities during the 12-h recording period. Statistical analysis was performed after transformation, data presented is on the original scale. Letter display was obtained by the method of Piepho (2012) from PROC GLIMMIX output. Values with the same letter are not significantly different (P = 0.05, Tukey-Kramer test). The number of SSA1-SG3 individuals was 40, 15, 15, and 14 on cassava, sweet potato, tomato, and cotton hosts, respectively, 28 and 15 of MED on cassava and sweet potato, respectively, and 5 and 9 of IO individuals on cassava and sweet potato, respectively.

