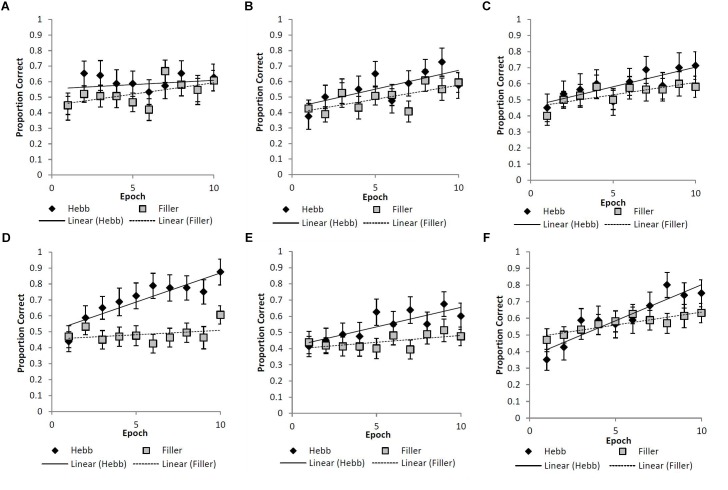
FIGURE 4.
(A–F) Mean proportion correct recall scores for the filler and Hebb sequences as a function of experimental epoch (1–10) for the (A) upright faces under conditions of full-stimulus-overlap, (B) inverted faces under conditions of full-stimulus-overlap, (C) abstract matrices under conditions of full-stimulus-overlap, (D) upright faces under conditions of no-stimulus-overlap, (E) inverted faces under conditions of no-stimulus-overlap, and (F) abstract matrices under conditions of no-stimulus-overlap. Line of best fit depicts the learning gradient for both sequence types. Error bars represent the standard error of the means.

